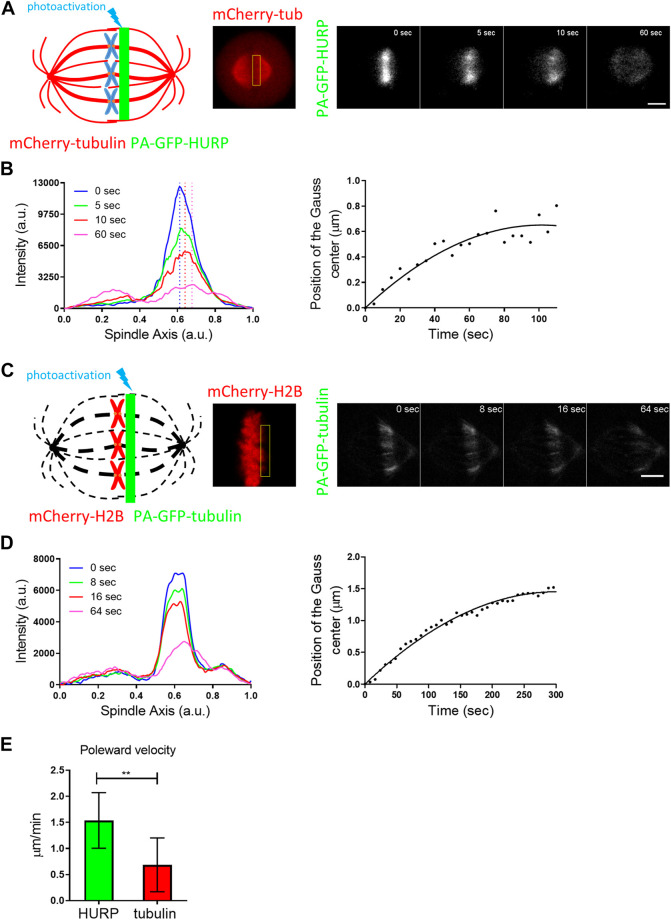
FIGURE 3.
PA-GFP-HURP molecules photoactivated at the chromosome zone (A) Left: Schematic representation of photoactivation experiments in cells co-expressing PA-GFP-HURP and mCherry-tubulin in HeLa Kyoto cells. A 2 μm-wide area perpendicular to the spindle long axis (green stripe) was used to photoactivate PA-GFP-HURP molecules. Middle: mCherry-tubulin signal was used as a spatial reference to photoactivate PA-GFP-HURP molecules at the chromosome zone and register moving spindles during data processing. Right: Representative images of PA-GFP-HURP molecules at different timepoints post photoactivation. Scale bar denotes 5 μm. (B) Left: Representative pole to pole fluorescence intensity profiles showing the distribution of the photoactivated PA-GFP-HURP molecules near the chromosomes, at different timepoints post photoactivation. The represents the first timepoint post photoactivation. The vertical dashed-lines designate the center of fluorescence distribution of photoactivated PA-GFP-HURP molecules at the corresponding timepoints. Right: Representative plot showing the center of fluorescence distribution over time, fitted by a second order polynomial to calculate PA-GFP-HURP poleward velocity. (C) Left: Schematic representation of photoactivation experiments in cells co-expressing PA-GFP-tubulin and mCherry-H2B, in HeLa Kyoto cells. A 2 μm-wide area perpendicular to the spindle long axis (green stripe) was used to photoactivate PA-GFP-tubulin molecules. Dark dashed-lines represent the expected mitotic spindle shape. Middle: mCherry-H2B signal was used as a spatial reference in order to photoactivate PA-GFP-tubulin at the chromosome zone, as well as to register cell movements during data processing. Right: Representative images of PA-GFP-tubulin at different timepoints post photoactivation. Scale bar denotes 5 μm. (D) Left: Representative pole to pole fluorescence intensity profiles showing the distribution of the photoactivated PA-GFP-tubulin molecules near the chromosomes, at different timepoints post photoactivation. The represents the first timepoint post photoactivation. Right: Representative plot showing the center of fluorescence distribution over time, fitted by a second order polynomial to calculate PA-GFP-tubulin poleward velocity (MT flux). (E) Comparison of PA-GFP-tubulin and PA-GFP-HURP poleward velocities. Values indicate the mean ± S.D. (PA-GFP-tubulin, n = 7 cells; PA-GFP-HURP, n = 14 cells; **p = 0.0042).

