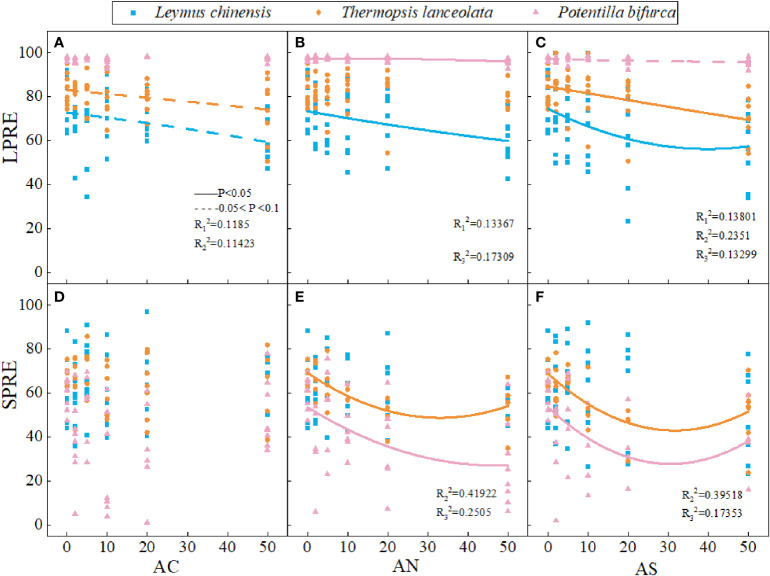
Figure 4.
Effects of nitrogen deposition on SPRE and LPRE of three species. The solid line represents P < 0.05, and the dashed line represents 0.05<P<0.1. (A) represents the LPRE of Leymus chinensis. (B) represents the LPRE of Thermopsis lanceolata. (C) represents the LPRE of Potentilla bifurca. (D) represents the SPRE of Leymus chinensis. (E) represents the SPRE of Thermopsis lanceolata. (F) represents the SPRE of Potentilla bifurca.

