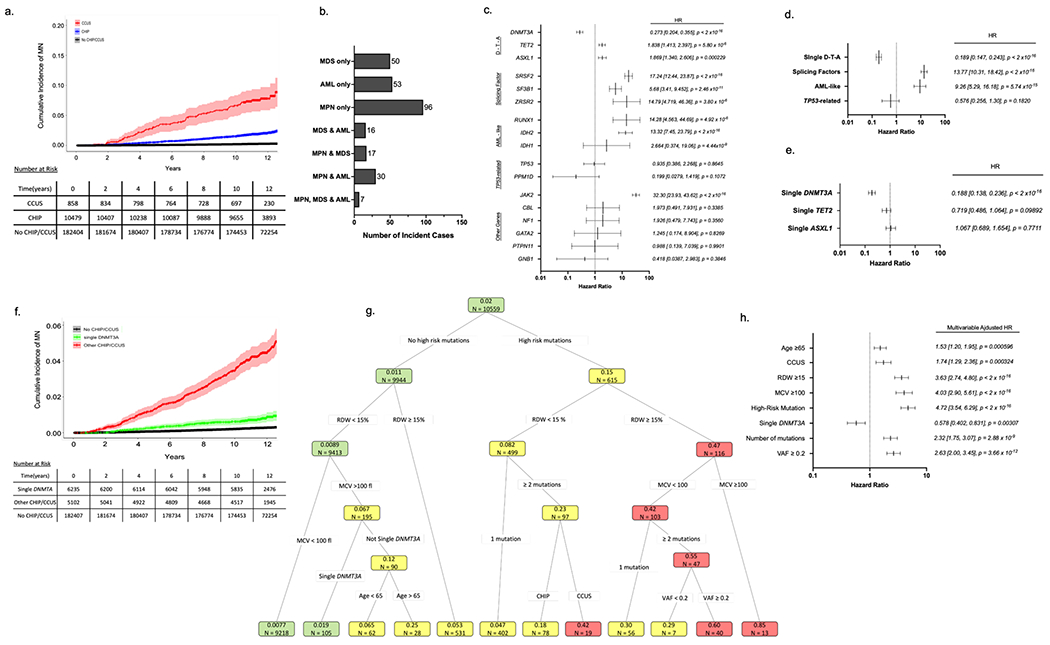
Figure 1 – Features influencing risk of myeloid neoplasia (MN) in UKB participants with CHIP/CCUS.

(a) Cumulative incidence of myeloid neoplasia (MN) in individuals with CHIP/CCUS compared to those without CHIP/CCUS. (b) Subtypes of MN among CHIP/CCUS patients who develop MN. (c) Univariate cox proportional hazard regression analysis for the 14 most commonly mutated genes in CH and (d) for groups of mutations including splicing factor mutations (SRSF2, SF3B1, ZRSR2) and AML-like mutations (IDH1, IDH2, FLT3, and RUNX1).) (e) Univariate analysis of single-DNMT3A, TET2 and ASXL1. (f) Cumulative incidence of MN for CHIP/CCUS possessing a single-DNMT3A mutation (green) compared to the cumulative incidence for all other CHIP/CCUS genotypes (red) and individuals without CHIP/CCUS (black). (g) For UK Biobank participants with at least 10-years of follow-up (n=10,559), recursive partitioning (RP) analysis was performed based on conditional probability of incident MN within 10-years. Of these, 207 incident MN events were recorded. Each node is annotated with number of individuals (n =) and probability of incident MN. Nodes are color coded as follows: probability ≤ 0.02 is green, 0.02-0.4 is yellow and >0.4 is red. Partitioning variable are all binary (presence vs absence of feature) and include high risk mutation (mutations in SRSF2, SF3B1, ZRSR2, IDH1, IDH2, FLT3, RUNX1 and JAK2), single DNMT3A, having ≥2 mutations, variant allele fraction (VAF) ≥0.2, having CCUS instead of CHIP, red cell distribution width (RDW) ≥15%, mean corpuscular volume (MCV) ≥100fl, and age ≥ 65 years. (h) Multivariable cox regression adjusted for assigned sex at birth, prior history of cancer and any history of smoking as confounders was performed on the entire cohort (n = 11,337) using features selected in RP analysis. For all Cox regression models hazard ratios (HR) are shown with error bars representing 95% confidence interval and numerical values for HR [95% confidence interval] and p-value for each feature analyzed.
