
Figure 2 – Clonal hematopoiesis risk score (CHRS) distribution and risk stratification in UKB Derivation Cohort.
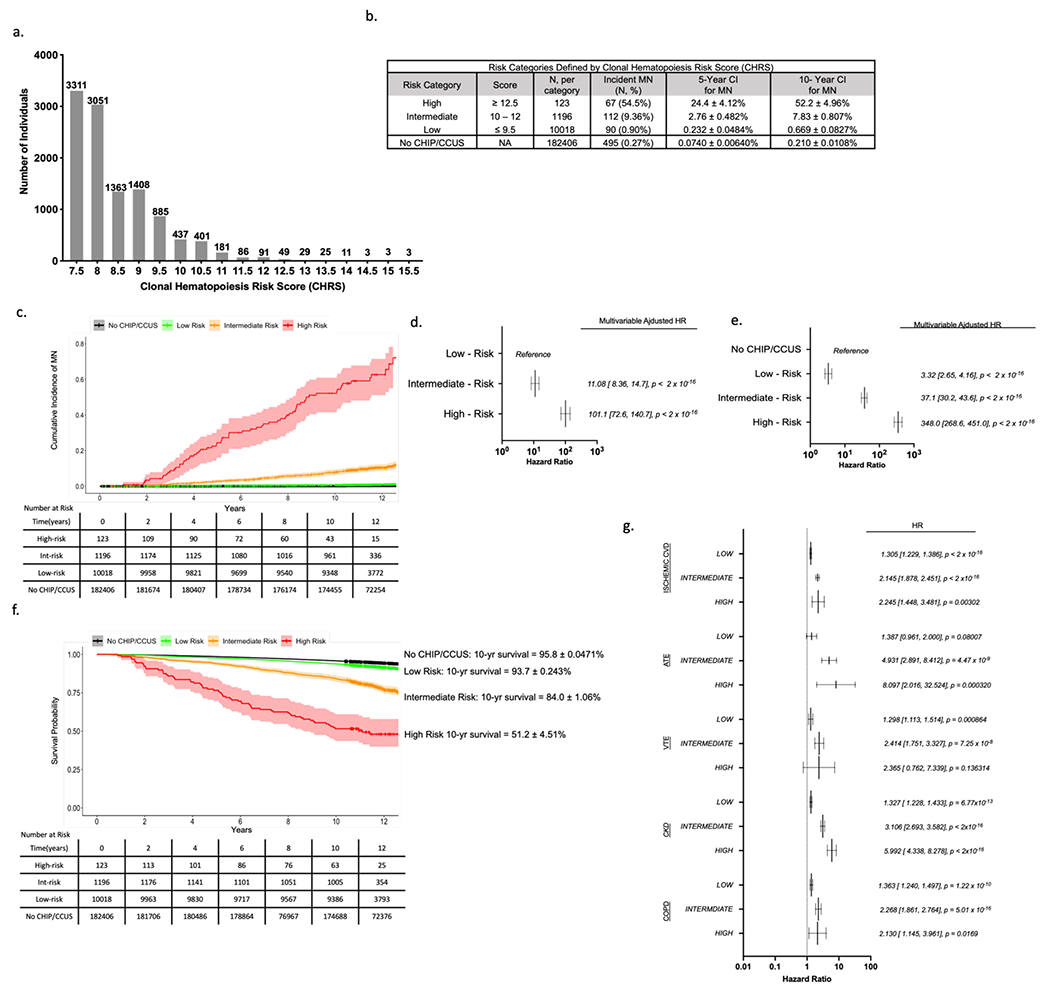
(a) Number of individuals with each possible CHRS value (number of individuals with each score is indicated above the bar). (b) Risk-Categories were defined by CHRS value with cutoffs chosen to minimize risk in low-risk strata. For each category, the number individuals in the risk group, number of myeloid neoplasia (MN) events and crude event rate (N, %), as well as the 5- and 10-year cumulative incidences (± standard deviation) is shown. Cumulative incidence of MN for individuals without CHIP or CCUS (No CHIP/CCUS) in the derivation cohort is included for reference. (c) Cumulative incidence curves of MN by CHRS risk category. Curves correspond to cumulative incidence analysis used to derive figures in panel (b). Hazard ratios for incident MN were determined for CHRS risk strata using Cox proportional hazards models adjusted for sex, smoking history and history of prior cancer. Hazard ratios were calculated in models with low risk strata as the reference population (d) and using the population of 182406 UKB participants in the No CHIP/CCUS group as the reference population (e). (f) Survival by CHRS risk category is shown, with 10-year survival is annotated to the right of the graph for each category. For both cumulative incidence and survival curves, Black = No CHIP/CCUS, Green = Low Risk, Orange = Intermediate Risk, and Red = High Risk. The ribbon about each curve indicates the 95% confidence interval. Tables show number at risk. (g) results of Cox regression analyses for non-malignant outcomes by CHRS risk group. For all outcomes, NO CHIP/CCUS is the reference population. Outcomes shown include ischemic cardiovascular disease (CVD) which is a composite of atherosclerosis, ischemic heart failure, myocardial infarction and stroke; arterial thromboembolic events (ATE); venous thromboembolic events (VTE); chronic kidney disease (CKD); and chronic obstructive pulmonary disease (COPD). For panels (d), (e) and (g), forest plots indicate HR (95% confidence interval) and p-values for main effects.