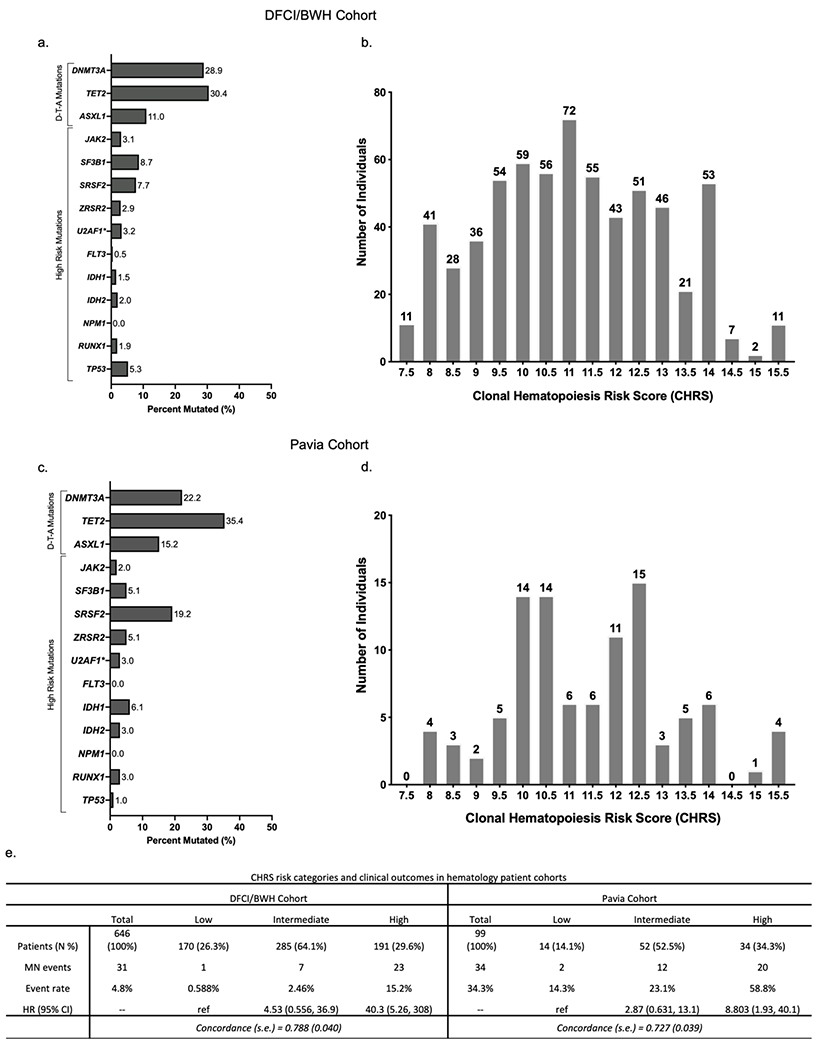
Figure 3 – External validation of CHRS in Hematology Patient Cohorts.

Distribution of mutations (a & c) and CHRS values in (b & d) in the DFCI/BWH CH cohort and Pavia CCUS cohorts. (e) CHRS risk categories and outcomes (incident MN) in DFCI/BWH cohort (left) and Pavia cohort (right). Number of patients with in each category is shown with percentage (N %). The number of incident myeloid neoplasia (MN) cases (MN events) and the event rate (MN events relative to number of individuals in that category, expressed as percentage). Cox proportional hazard models were used to obtain hazard ratios (95% CI) for each CHRS risk strata and performance of the CHRS model is estimated by the concordance statistic (c-index ± standard error) when applied to each cohort.
