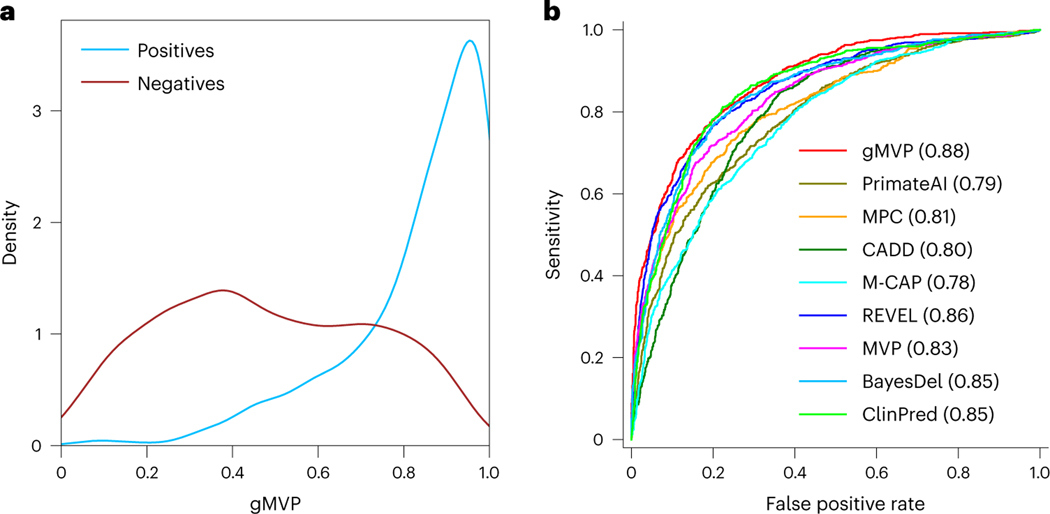
Fig. 2 |. Evaluating gMVP and published methods using cancer somatic mutation hotspots and random variants in population.
a, The gMVP score distributions for variants in cancer hotspots (labelled positives) and random missense variants in population (labelled negatives). b, Comparisons between the ROC curves of gMVP and other published methods. The ROC curves are evaluated on 878 cancer mutations located in hotspots from 209 genes and 1,756 (that is, a twofold greater number of positives) randomly selected rare variants from the DiscovEHR data.

