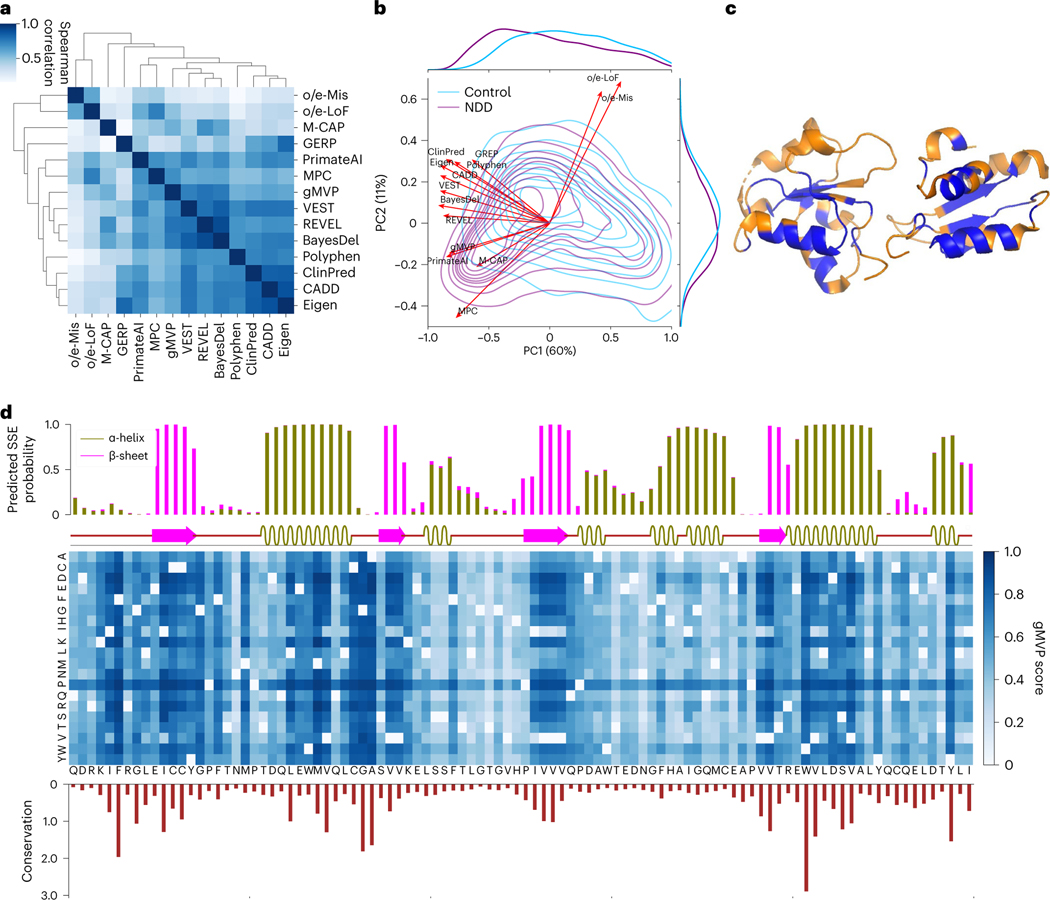
Fig. 6 |. Interpreting gMVP predictions with conservation, protein structure and genetic coding constraints.
a, Spearman correlation between gMVP and other published methods, calculated by scores of the DNMs in ASD, NDD and controls. b, PCA on DNMs from ASD and NDD cases and controls. Red arrows show the loadings of gMVP and published methods on the first two components; the density contour shows the distribution of PC1/2 scores of the variants in NDD and controls. The density curves along the axes show the distribution of PC1 or PC2 scores of the cases and controls. c, The protein tertiary structure of BRCT2 domain of BRCA1. We coloured a residue blue if at least one missense on this position is predicted to be damaging (gMVP > 0.75) and orange otherwise. d, gMVP scores of all possible missense variants on the BRCT2 domain of BRCA1. The top bar plot shows the predicted probabilities of the protein secondary structures, whereas the bar below shows the real protein secondary structures calculated by DSSP. The middle heat map shows gMVP scores for all possible missense variants on each protein position (the darker the colour, the higher the gMVP score). The bottom histogram shows the evolutionary conservation measured with the Kullback–Leibler divergence between amino acid distribution among homologous sequences and amino acid distribution in nature.

