
Extended Data Fig. 10 |. Characteristics of Ldlr−/− mice receiving 0 ppm compared to Ldlr−/− mice receiving 150 ppm BAY-747 after ten weeks of Western diet.
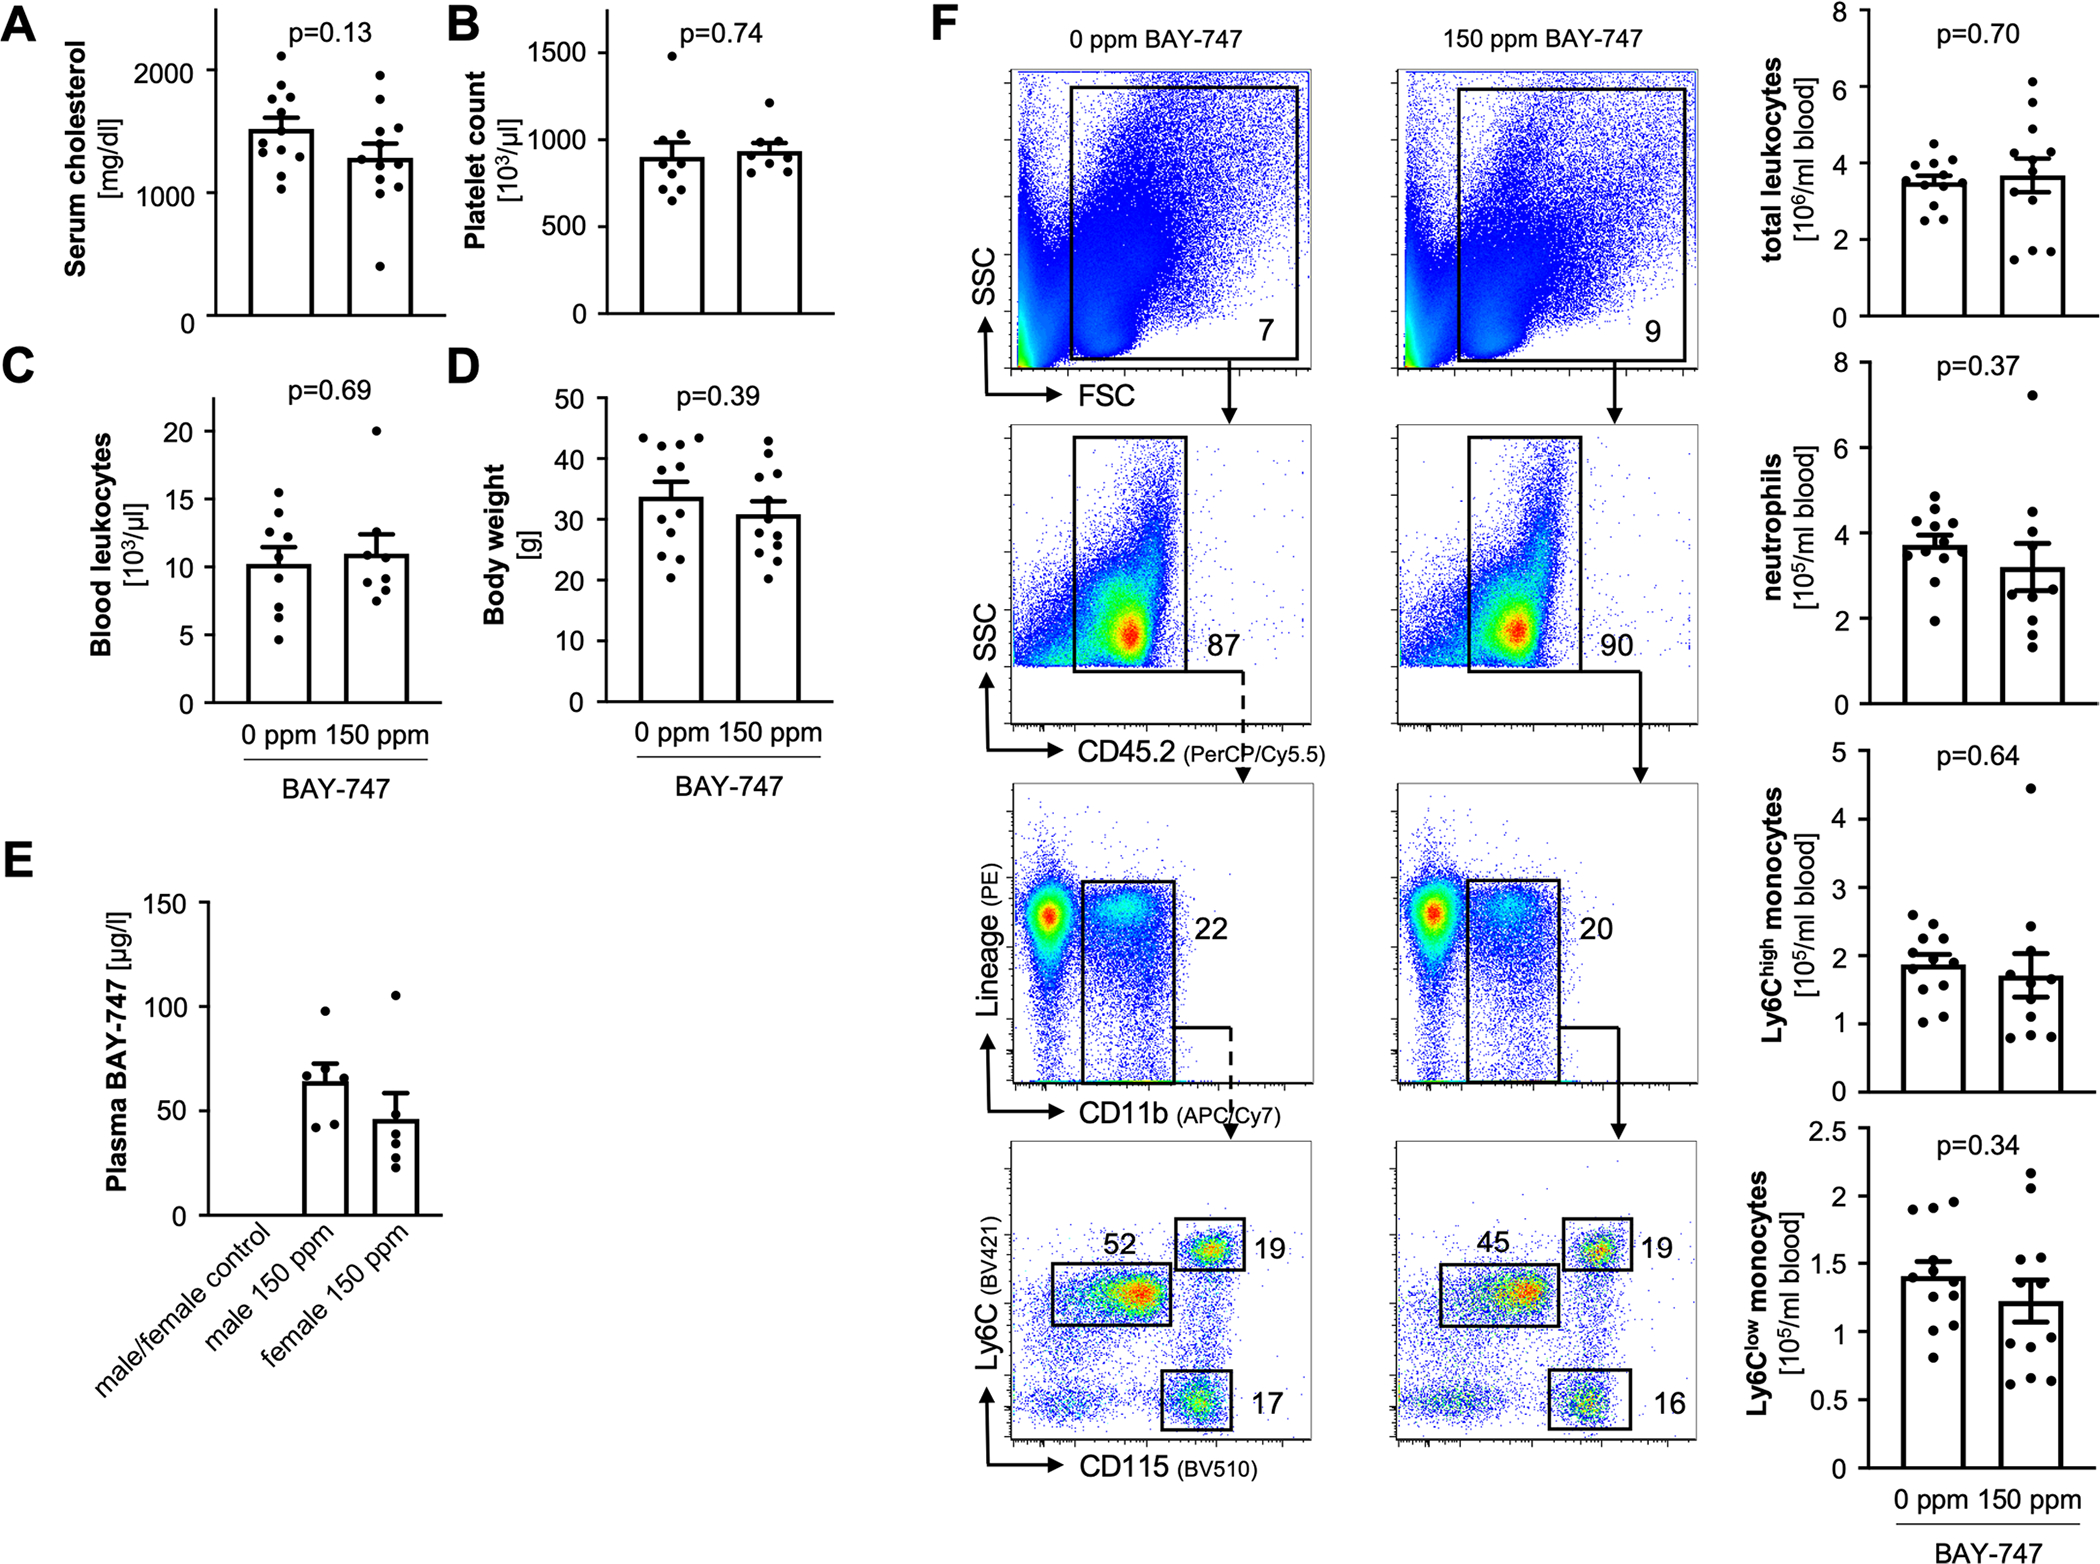
a. Serum cholesterol levels (n = 12). b. Platelet count (n = 9 in 0 ppm, n = 8 in 150 ppm group). c. Blood leukocytes (n = 9 in 0 ppm, n = 8 in 150 ppm group). d. Body weight after (n = 12). e. Plasma concentrations of the soluble guanylyl cyclase stimulator BAY-747 in treated mice. f. Blood leukocyte numbers and subsets. Each symbol represents one independent animal (n = 12). Two-sided unpaired t-test. Two outliers were removed in the analysis of F: neutrophils (150 ppm group; n = 10) and Ly6Chigh monocytes (150 ppm group; n = 11) according to the ROUT method. Data are mean and s.e.m.