
Extended Data Fig. 1 |. sGC-Expression in Pf4-Cre+Gucy1b1LoxP/LoxP compared to Pf4-Cre+Gucy1b1+/LoxP mice.
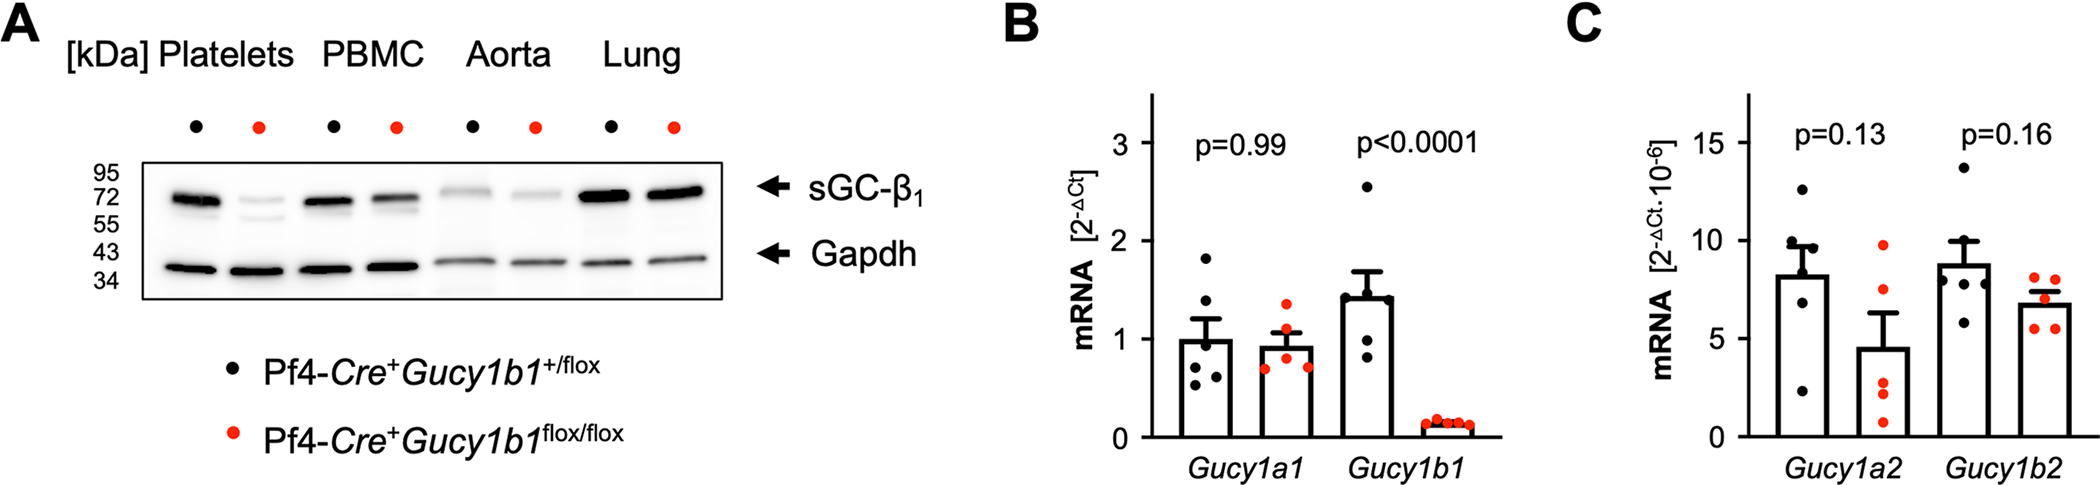
a. Expression of sGC-β1 in platelets, peripheral blood mononuclear cells (PBMC), aorta, and lung. Representative of three independently performed Western blots on different samples. B+C. Gucy transcript expression analysis in megakaryocytes of Pf4-Cre+Gucy1b1+/LoxP and Pf4-Cre+Gucy1b1LoxP/LoxP mice. b. Gucy1a1 and Gucy1b1. C. Gucy1a2 and Gucy1b2. Each symbol represents one independent animal (n = 6 for control group, n = 5 for Pf4-Cre+Gucy1b1LoxP/LoxP). Two-sided unpaired t-test. Data are mean and s.e.m.