
Figure 6:
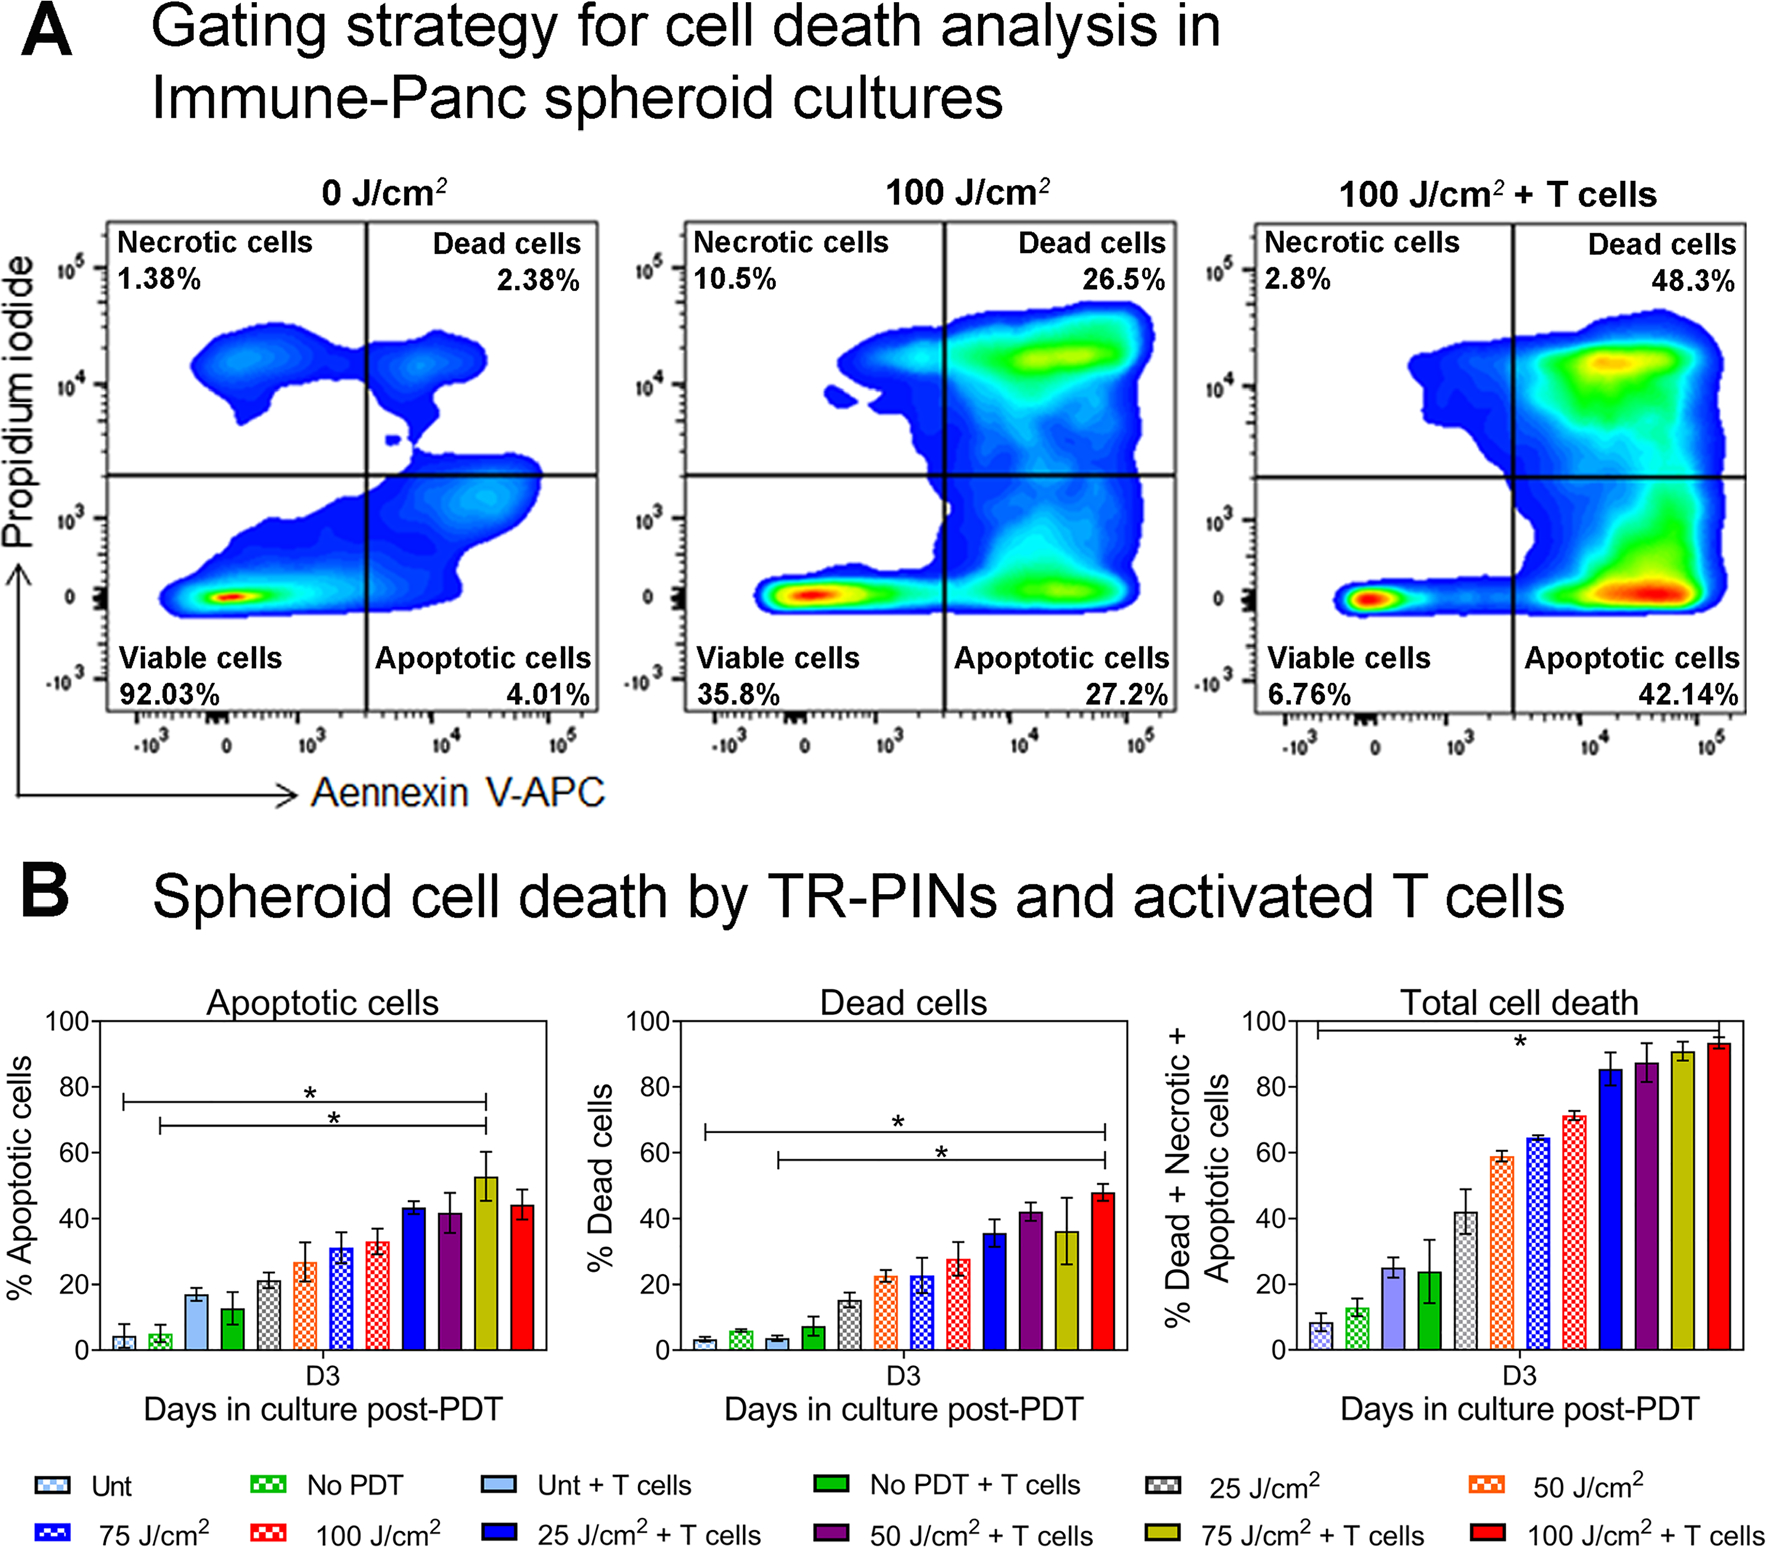
Synergistic effects on MIA PaCa-2 – PCAF cell killing by TR-PINs and antitumor reactive T cells.
Analysis of cell death was performed using Annexin V and Propidium Iodide (PI) staining. (A) As shown in the gating strategy for cell death analysis, Panc spheroids were double-stained with Annexin V and PI and analyzed using flow cytometry. Four populations were identified as viable cells, apoptotic cells, dead cells, and necrotic cells as indicated in the flow cytometry plots. Quantification of apoptotic cells, dead cells, and total cell death (sum of apoptotic and dead cells including necrotic cells) under different culture conditions, is shown in figure (B). Data are means ± SEM from three independent experiments done in duplicates. Statistical significance was determined by a one-way ANOVA and Tukey’s posthoc test. Asterisks denote statistical significance (*P < 0.05). The NIR photodynamic activation regimen used 690 nm light irradiation with 25 or 50 or 75 or 100 J/cm2 at 150 mW/cm2. TR-PINs (BPD-PC equivalent) were used at a concentration of 250 nM.
Key to conditions: Unt: untreated Panc spheroids (MIA PaCa-2 and PCAF) without T cells nor any nanoconstruct; No PDT: Panc spheroids with TR-PINs alone but no illumination; Unt + T cells: untreated Panc spheroids with T cells (Immune-Panc spheroids); No PDT + T cells: Immune-Panc spheroids with TR-PINS without illumination; 25, 50, 25, 75, or 100 J/cm2: Panc spheroids with TR-PINS and PDT at the indicated dose of light without T cells; 25J/cm2 + T cells, 50J/cm2 + T cells, 75J/cm2 + T cells, or 100 J/cm2 + T cells; Immune-Panc spheroids with TR-PINS and PDT at the indicated dose of light.