
Figure 2:
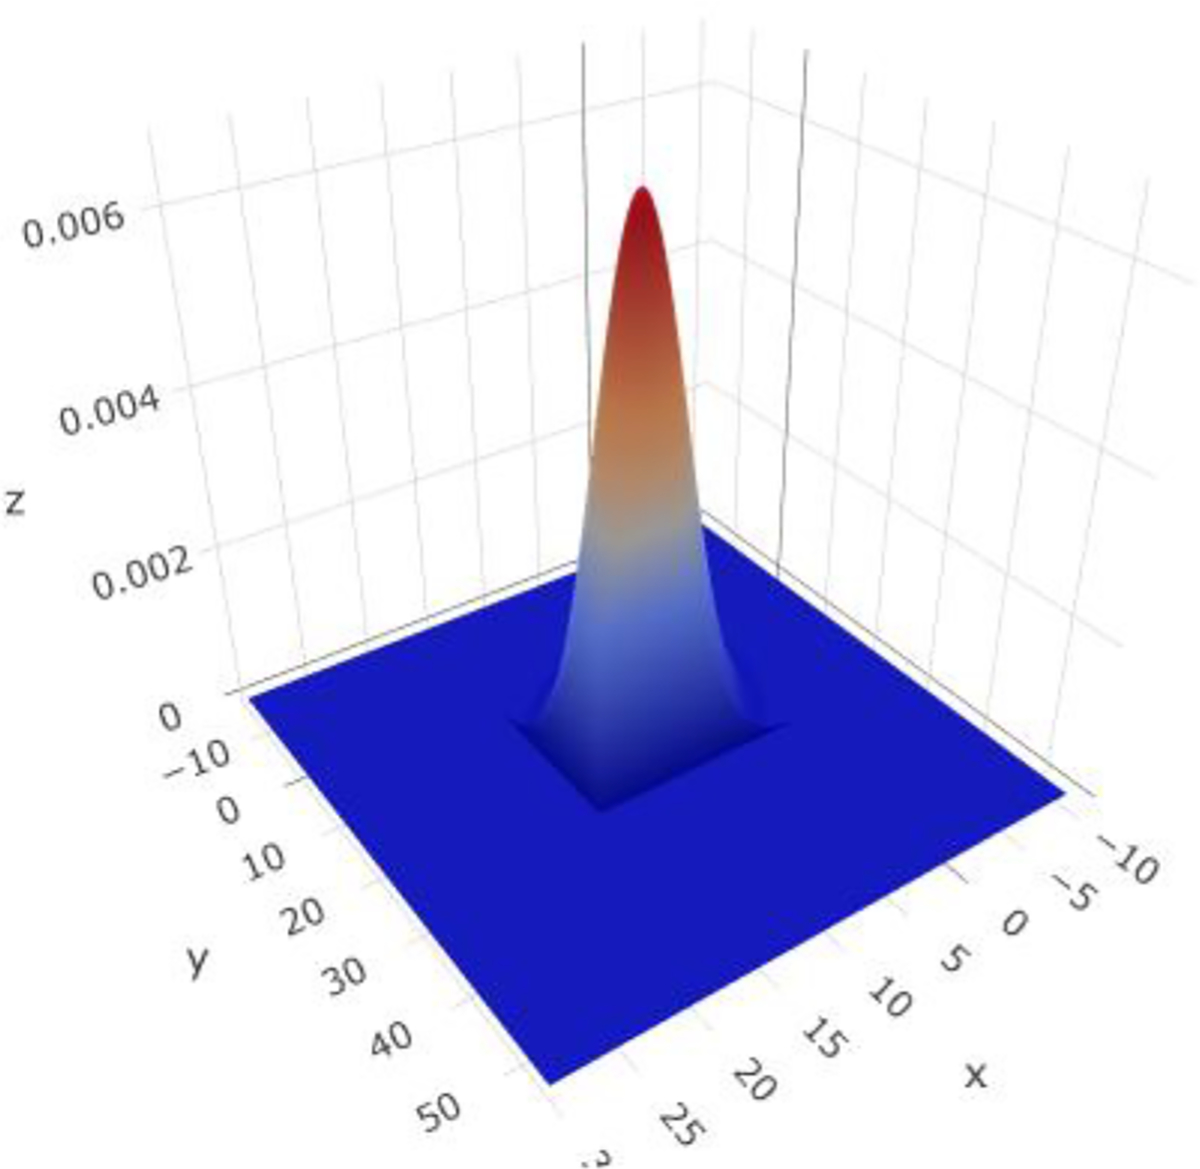
Joint bivariate probability of the rabbit (variable ) and wolf (variable ) populations , , , , derived from univariate normal marginals. This example shows the graphical representation of .
Official websites use .gov
A
.gov website belongs to an official
government organization in the United States.
Secure .gov websites use HTTPS
A lock (
) or https:// means you've safely
connected to the .gov website. Share sensitive
information only on official, secure websites.
Joint bivariate probability of the rabbit (variable ) and wolf (variable ) populations , , , , derived from univariate normal marginals. This example shows the graphical representation of .