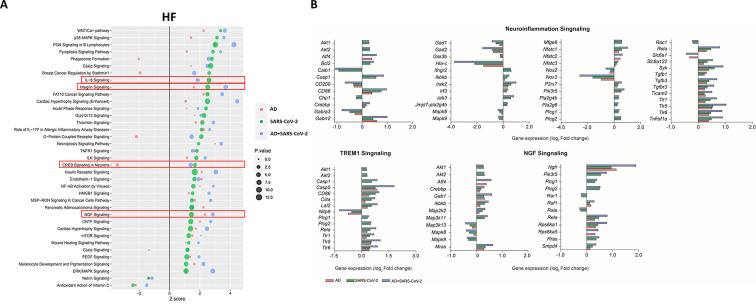
Figure 4. Changes in signaling pathways within the hippocampal formation (HF).
(A) The similarities of canonical pathways reveal the top regulated canonical pathways were compared within the HF in Alzheimer’s disease (AD), SARS-CoV-2, and SARS-CoV-2-infected AD cases in reference to the control. The X-axis represents the activation score (Z-score), while the Y-axis indicates the pathways. The color of the points reflects the Ingenuity Pathway Analysis (IPA) comparison, while the size of each point corresponds to the -log10 p-value of the IPA comparison, with larger points indicating lower p-values. (B) The predicted gene regulation of the Neuroinflammation, TREM1, and nerve growth factor (NGF) pathways indicates that AD (red bar), SARS-CoV-2 (green bar), and SARS-CoV-2-infected AD groups (blue bar) have similar expression in key inflammatory and neuronal pathways. The X-axis represents log2 fold-change (log2 FC).

