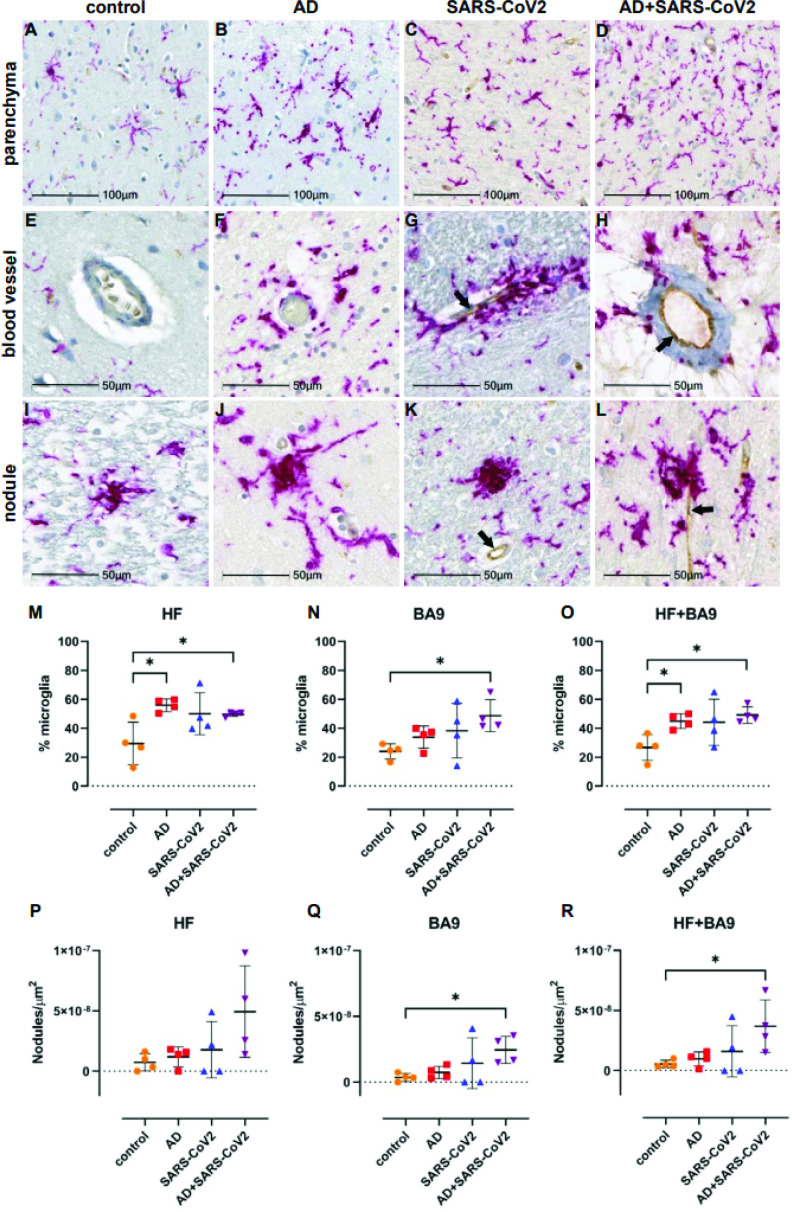
Figure 5. Microgliosis and nodular lesions in neurological controls, SARS-CoV-2, Alzheimer’s disease (AD), and SARS-CoV-2-infected AD individuals.
The level of microglial activation was assessed by immunohistochemical staining using anti-Iba-1 antibody with Vector Red. The presence of SARS-CoV-2 was assessed using an antibody against the virus nucleocapsid and visualized with DAB. (B–D) Parenchymal microglia are more frequent and highly activated in the context of infection with and without AD, as shown by thickened processes, enlarged soma, and loss of individual cellular domain, compared to age-matched controls (A, E). When present, SARS-CoV-2 localizes to the blood vessel endothelium (black arrows; G, H, K, L). (F–H) Microglia appear to gather around blood vessels in disease but do not form cuffs. (I–L) Nodular lesions are seen in most cases assessed, regardless of disease status; however, they appear larger and more frequent in the context of disease (J–L), compared to controls (I). (M–O) A multiplex algorithm was used to count all cells, using DAPI+ nuclei, with HALO and calculate percent frequency of Iba-1+ microglia. Each point on the graphs shown represents the average finding per total brain area for each subject. (M) There was upregulation of Iba-1 in the hippocampus compared to the cortical Brodmann area 9 (BA9) region for most cases, though there is a significantly higher ratio of microglia relative to other cells when comparing the AD and SARS-CoV-2-infected AD cases to the control group shown. (N) This trend seems to hold true for cortical BA9 region as well, where the only groups with a significant difference in microglia ratios are the control and SARS-CoV-2-infected AD cases shown. (O) When all cases have both regions averaged, the level of microgliosis is shown to be higher in the AD and SARS-CoV-2-infected AD cases compared to control. (P–R) Graphs show the normalized counts of microglial nodule frequency. (P) A higher frequency of nodules is seen in the HF; however, the difference between groups did not reach statistical significance. (Q) In contrast, fewer nodules are seen in cortical BA9, overall. A statistically significant higher number of lesions are seen in SARS-CoV-2-infected AD cases compared to control cortical BA9, suggesting greater inflammation in the cortical BA9 of patients with both AD and SARS-CoV-2 infection. (R) Significance was maintained between the control and SARS-CoV-2-infected AD groups when the average was taken for both brain regions per case. Statistics were performed with a two-tailed Mann–Whitney U-test. *p<0.05. Data are expressed as mean ± SEM.

