
Figure 3. Evolution of the lattice size distribution at different reaction rates and hexamer interaction strengths.
(A) Along the x-axis are the numbers of monomers found in each lattice, which is largely bimodal for all systems: a population of small oligomers and one giant connected component. As time progresses (from left to right columns), the initial structure which was one giant connected component continues to fragment somewhat, indicating that the starting structure was not at equilibrium. As the on- and off-rates increase (from top to bottom) with a fixed , the largest component shrinks, as shown by the peak denoting the large giant component shifting to the left, and the peak denoting the small oligomers shifting to the right. (B) For a weaker hexamer free energy shown in the blue data (), the lattice is breaking apart more rapidly and moving toward a more uniform distribution of lattice patch sizes as both peaks shift to the center. Note that we cut off the y-axis at 0.005 to make the peak at ~2500 visible. The bars at small sizes extend up to ~0.05. (C) Representative structures at the later times (t=17 s) for each case, illustrating the increased fragmentation as the rates accelerate, or as the hexamer contacts destabilize (lowest row). We quantify the corresponding diffusivity of the structures in Figure 3—figure supplement 1. We show how changes to have a minimal impact on the structural dynamics in Figure 3—figure supplement 2.

Figure 3—figure supplement 1. Distribution of the diffusion constant of each molecule.
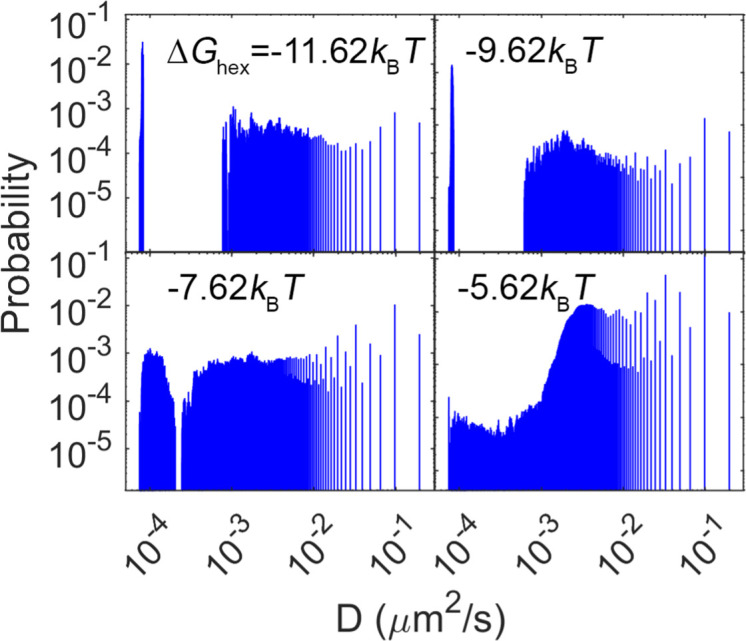
Figure 3—figure supplement 2. Comparison of complex size distribution over the first 0–1 s of simulations with two values of .
