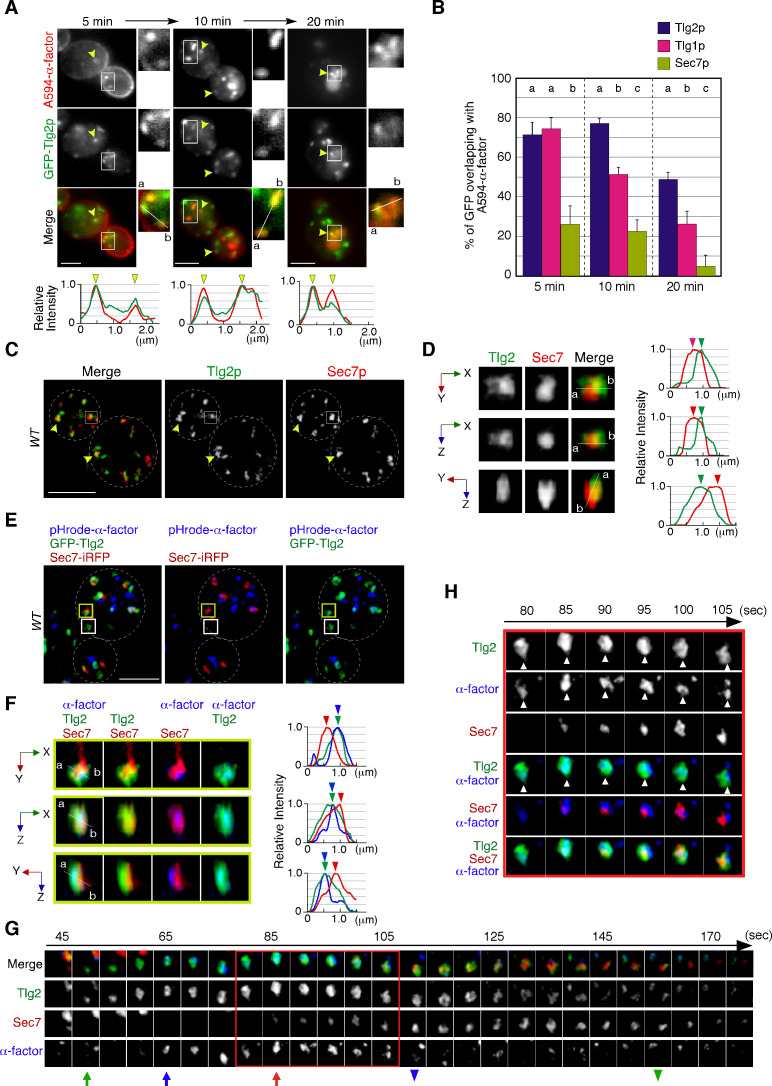
Figure 1. Localization of endocytosed α-factor at the Tlg2p-residing compartment.
(A) 2D imaging of A594-α-factor and GFP-Tlg2p. Arrowheads indicate examples of overlapping localization. Representative fluorescence intensity profiles along a line (direction from ‘a’ to ‘b’) are indicated in the lower panels. (B) Quantification of GFP-Tlg2p, GFP-Tlg1p, and Sec7-GFP overlapping with A594-α-factor. Data show the mean ± SEM from n ≥ 3 experiments (n > 30 puncta for each experiment). Different letters indicate significant differences at p<0.05 between the indicated times (i.e., no significant difference for a vs. a, significant difference for a vs. b with p<0.05), one-way ANOVA with Tukey’s post hoc test. Error bars indicate the standard SD from n ≥ 3 experiments (n ≥ 30 puncta for each experiment). (C) 3D super-resolution confocal live imaging microscopy (SCLIM) imaging of GFP-Tlg2p and Sec7-mCherry. White dashed lines indicate cell edges. (D) Multi-angle magnified 3D views of the boxed area and the representative fluorescence intensity profiles. Line scan as in (A) shown at right. (E) 3D SCLIM imaging of GFP-Tlg2p, Sec7-iRFP, and pHrode-α-factor; boxed areas shown magnified in (F–H). The images were acquired simultaneously at 5 min after pHrode-α-factor internalization. (F) Multi-angle magnified 3D views of the yellow-boxed area in (E). Line scan as in (A) shown at right. (G) Time series of region in the white-boxed area in (E). Arrows and arrowheads denote the appearance and disappearance of each marker. (H) Higher-magnification views of the red-boxed area in (G). Scale bars, 2.5 μm.


