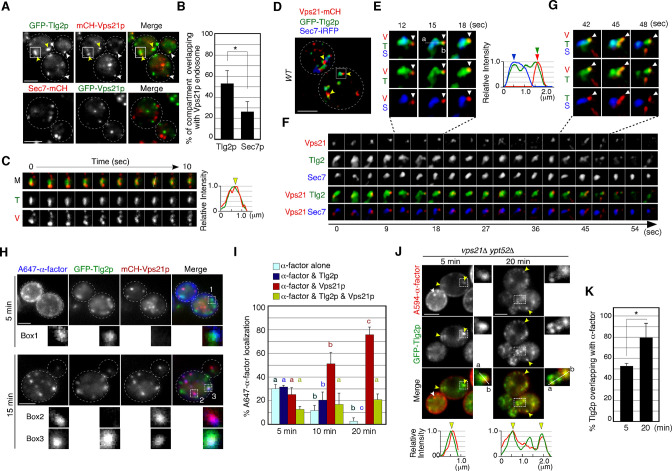
Figure 3. Alexa-α-factor is transported from the Tlg2p-residing compartment to the Vps21p-residing endosomal compartment.
(A) 2D imaging of GFP-Tlg2p or Sec7-mCherry and mCherry/GFP-Vps21p. (B) Quantification of Tlg2p or Sec7p overlapping with Vps21p. Error bars indicate the SD from n ≥ 3 experiments (n≥30 puncta for each experiment). (C) Time series of the region in the boxed area in (A). Representative fluorescence intensity profiles along a line in the merged image at 8s are shown on the right. Yellow arrowhead indicates overlapping localization. (D) 4D super-resolution confocal live imaging microscopy (SCLIM) imaging of GFP-Tlg2p, Sec7-iRFP, and mCherry-Vps21p. Arrowheads indicate examples of the association of GFP-Tlg2p and mCherry-Vps21p. (E) Magnified views from the time-series in (F). Arrowheads indicate a Vps21p-residing endosome. Representative fluorescence intensity profiles along a line in the merged images at 15s are shown to the right. (F) Time series of the region in the boxed area in (D). (G) Further magnified views from the time series in (F). (H) 2D imaging of A647-α-factor, GFP-Tlg2p, and mCherry-Vps21p. The images were acquired at 5 and 15min after A647-α-factor internalization. Higher-magnification views of the boxed areas are shown in the lower panels. (I) Quantification of A647-α-factor overlapping with GFP-Tlg2p or mCherry-Vps21p. Data show the mean ± SEM from n ≥ 3 experiments (n > 30 puncta for each experiment). Comparisons are made between the same colors, with different letters indicating significant difference (p<0.05) between the indicated times, one-way ANOVA with Tukey’s post hoc test. (J) 2D imaging of A594-α-factor and GFP-Tlg2p in vps21Δ ypt52Δ cells. The images were acquired at 5 and 20min after A594-α-factor internalization. Higher-magnification views of the boxed area are shown in the right panels. Arrowheads indicate examples of the overlapping localization of A594-α-factor and GFP-Tlg2p. (K) Quantification of GFP-Tlg2p overlapping with A594-α-factor. Error bars indicate the SD from n ≥ 3 experiments (n > 30 puncta for each experiment). *p<0.05, unpaired t-test with Welch’s correction. Scale bars, 2.5μm.

