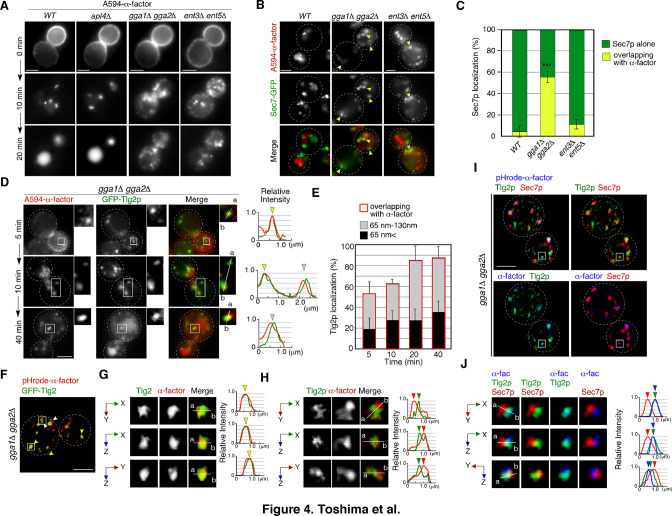
Figure 4. GGA adaptors are required for export of A594-α-factor out of the Tlg2p-residing compartment.
(A) 2D imaging of A594-α-factor in cells lacking clathrin adaptor proteins. (B) 2D imaging of A594-α-factor and Sec7-GFP in cells lacking clathrin adaptor proteins. The images were acquired simultaneously at 20min after A594-α-factor internalization. Arrowheads indicate examples of overlapping localization. (C) Quantification of Sec7-GFP overlapping with A594-α-factor. Error bars indicate the SD from n ≥ 3 experiments (n > 30 puncta for each experiment). ***p<0.001, unpaired t-test with Welch’s correction. (D) 2D imaging of A594-α-factor and GFP-Tlg2p in gga1Δ gga2Δ cells. Higher-magnification views of the boxed area are shown in the right panels. Representative fluorescence intensity profiles along lines in the merged images are indicated in the right panels. (E) Quantification of GFP-Tlg2p overlapping with A594-α-factor in gga1Δ gga2Δ cells. The bars surrounded by red lines indicate the total ratio of the Tlg2p sub-compartment overlapping with α-factor. Error bars indicate the SD from n ≥ 3 experiments (n > 30 puncta for each experiment). (F) 3D SCLIM imaging of GFP-Tlg2p and pHrode-α-factor in gga1Δ gga2Δ cells. The images were acquired simultaneously at 20min after pHrode-α-factor internalization. (G, H) Multi-angle magnified 3D views of the boxed areas in (F), representing co-localization (G) or adjacent localization (H) of GFP-Tlg2p and pHrode-α-factor. (I) 3D SCLIM imaging of GFP-Tlg2p, Sec7-iRFP, and pHrode-α-factor in gga1Δ gga2Δ cells. The images were acquired simultaneously at 10min after pHrode-α-factor internalization. (J) Multi-angle magnified 3D views of the boxed area in (I). Scale bars, 2.5μm.

