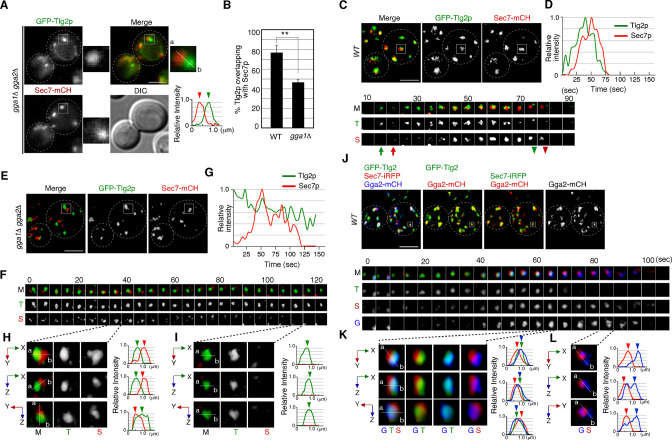
Figure 5. The transition from the Tlg2p- to the Sec7p-residing compartment requires GGA adaptors.
(A) 2D imaging of GFP-Tlg2p and Sec7-mCherry in gga1Δ gga2Δ cells. Representative intensity profiles of GFP-Tlg2p or Sec7-mCherry along a line in the merged images are indicated in the right lower panel. (B) Quantification of GFP-Tlg2p overlapping with Sec7-mCherry in wild-type and gga1Δ gga2Δ cells. Error bars indicate the SD from n ≥ 3 experiments (n > 30 puncta for each experiment). **p<0.01, unpaired t-test with Welch’s correction. (C, E) 4D super-resolution confocal live imaging microscopy (SCLIM) imaging of GFP-Tlg2p and Sec7-mCherry in wild-type cells (C) and gga1Δ gga2Δ cells (E).The time series of regions in the boxed areas in (C) are shown in the lower panels. Arrows and arrowheads denote the appearance and disappearance of each marker. (D, G) Time-course changes in relative fluorescence intensity of GFP-Tlg2p and Sec7-mCherry in the boxed areas in (C) or (E). (F) Time series of the region in the boxed area in (E). (H, I) Multi-angle magnified 3D views from (F). (J) 4D SCLIM imaging of GFP-Tlg2p, Gga2-mCherry, and Sec7-iRFP. The time series of regions in the boxed areas in (J) are shown in the lower panels. (K, L) Multi-angle magnified 3D views of time points from (J).Scale bars, 2.5μm.


