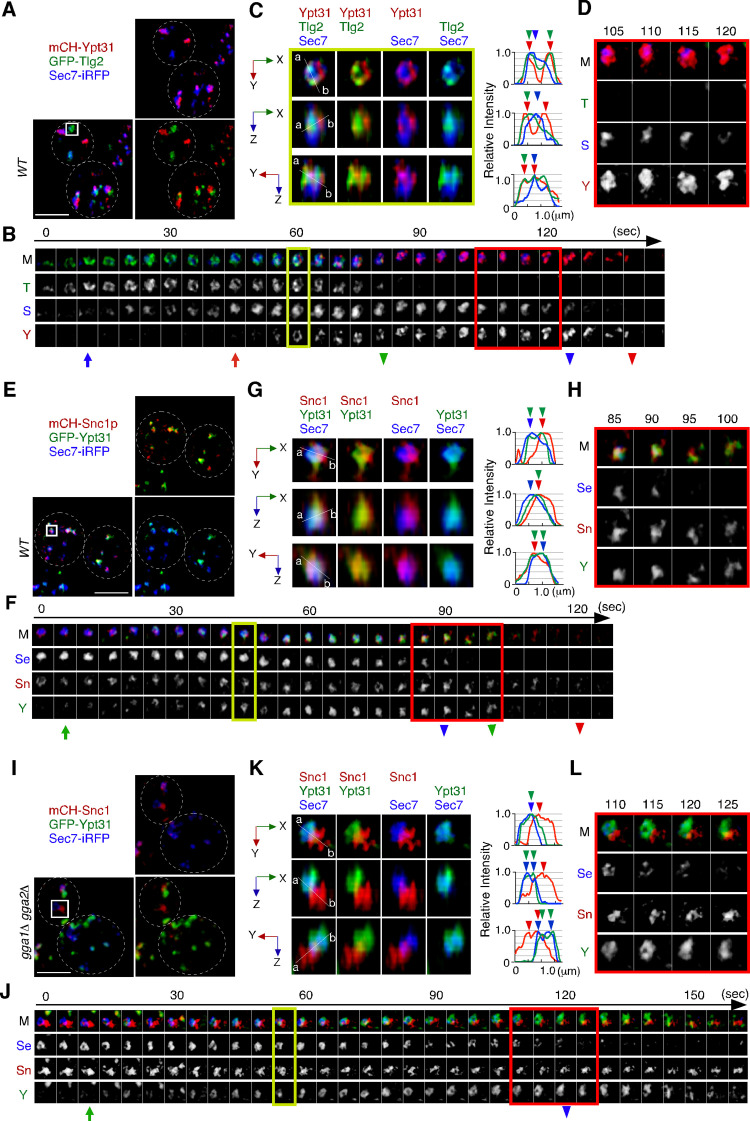
Figure 7. Ypt31p is localized at both the Tlg2p-residing compartment and the Sec7p-residing compartment.
(A–D) 4D super-resolution confocal live imaging microscopy (SCLIM) imaging of GFP-Tlg2p, mCherry-Ypt31p, and Sec7-iRFP in wild-type cells. (B) Time series of regions in the boxed area in (A). Arrows and arrowheads denote the appearance and disappearance of each marker. (C) Multi-angle magnified 3D views from the 60 s image in (B). Representative fluorescence intensity profiles along lines (direction from ‘a’ to ‘b’) in the merged images are indicated in the right panels. (D) Higher-magnification views of the red-boxed area in (B). (E–H) 4D SCLIM imaging of GFP-Ypt31p, mCherry-Snc1p and Sec7-iRFP in wild-type cells. (F) Time series of regions in the boxed area in (E). Arrows and arrowheads denote the appearance and disappearance of each marker. (G) Multi-angle magnified 3D views from the 45 s image in (F). Representative fluorescence intensity profiles along lines (direction from ‘a’ to ‘b’) in the merged images are indicated in the right panels. (H) Higher-magnification views of the red-boxed area in (F). (I–L) 4D SCLIM imaging of GFP-Ypt31p, mCherry-Snc1p, and Sec7-iRFP in gga1Δ gga2Δ cells. (J) Time series of regions in the boxed area in (I). Arrows and arrowheads denote the appearance and disappearance of each marker. (K) Multi-angle magnified 3D views from the 55 s image in (J). Representative fluorescence intensity profiles along lines (direction from ‘a’ to ‘b’) in the merged images are indicated in the right panels. (L) Higher-magnification views of the red-boxed area in (J). Scale bars, 2.5 μm.


