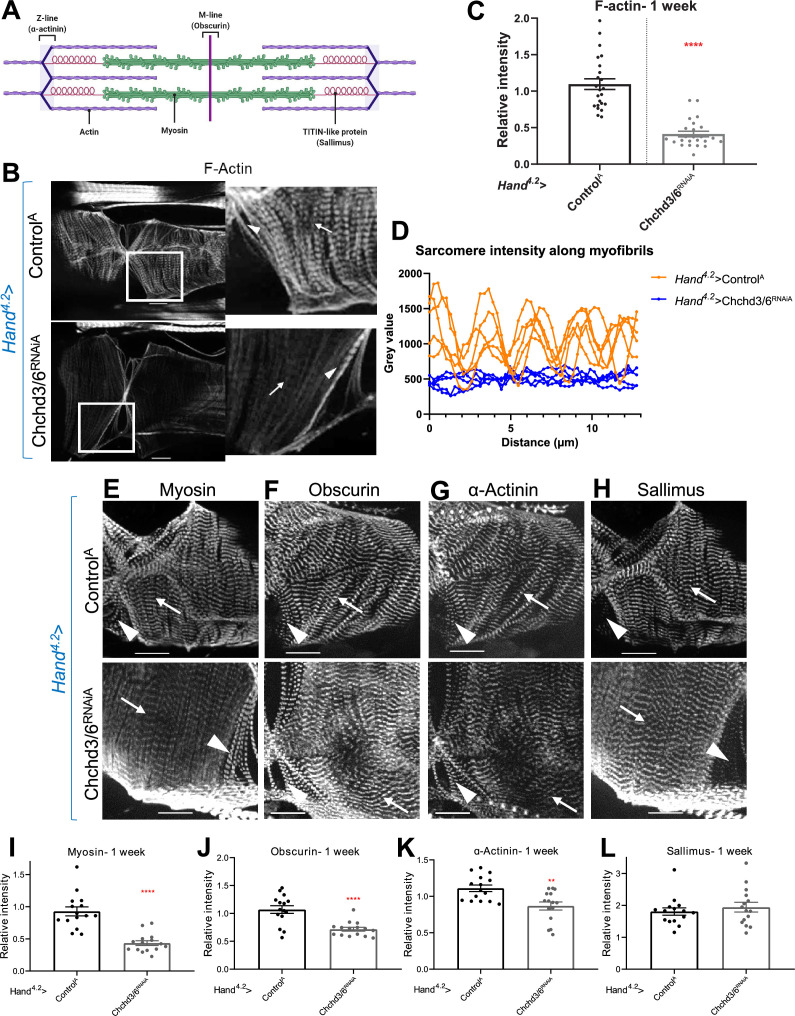
Figure 3. Cardiac tissue from heart-specific Chchd3/6 KD flies exhibit reduced and altered sarcomeric proteins in the myocardial tissue.
(A) Schematic of sarcomeric protein distribution inside myofibrils (image created with BioRender.com). (B) F-actin staining in 1-week-old female Drosophila hearts with Hand4.2-Gal4 KD of Chchd3/6. Arrowheads indicate ostial myofibrils and arrows point to myocardial myofibrils (non-ostial). (C) F-actin intensity measured as mean gray value (gray value/# of pixels) along myocardial myofibrils relative to mean gray value of ostial myofibrils. (D) Mean intensity of F-actin along individual myofibrils. One-week-old Drosophila hearts with Hand4.2-Gal4 driven KD of control or Chchd3/6 stained for antibodies against (E) Myosin, (F) Obscurin, (G) α-Actinin, or (H) Sallimus. Arrowheads indicate ostial myofibrils and arrows point to working cardiomyocyte tissue (non-ostial). (I–L) Mean fluorescence intensity along myocardial myofibrils relative to ostia myofibrils in 1-week-old Hand4.2-Gal4>CHCHD3/6RNAiA adults stained for sarcomeric proteins (I) Myosin, (J) Obscurin, (K) α-Actinin, or (L) Sallimus. Unpaired two-tailed t-test, **p≤0.01, ****p≤0.0001; error bars represent SEM. 20 µm scale.


