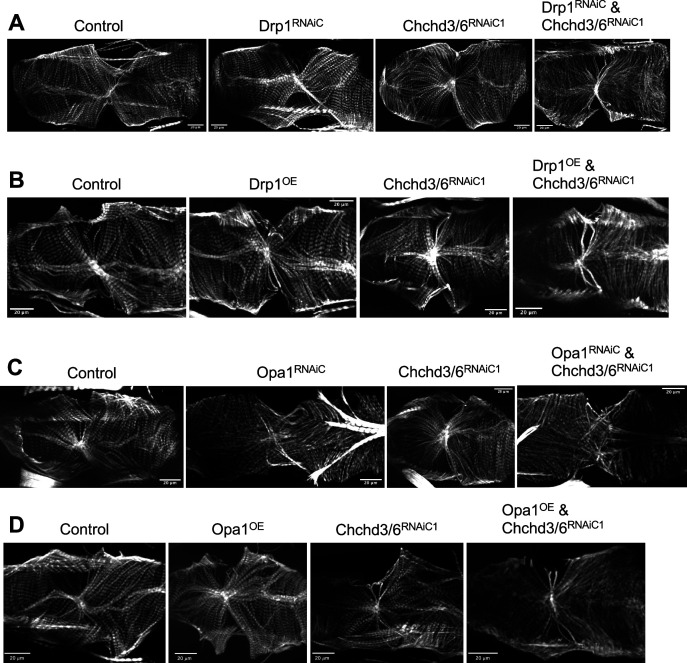
Figure 4. Mitochondrial fission-fusion defects were observed in cardiac Chchd3/6 KD.
(A–E) Visualization of F-actin and mitochondria in Drosophila indirect flight muscles (IFMs). 1–2 day-old male Drosophila IFMs with Mito::GFP; Mef2-Gal4 stained for (A) F-actin, (B) GFP (Mito::GFP (GFP tagged COX8A)), (C) ATP synthase, (D) merged image of B+C, and (E) merged image of A+B,10µm scale. (F) Hand4.2>Chchd3/6RNAiA heart tissue at 1 week of age. (G–I) F-actin and Mito::GFP staining in 1-week-old female hearts using the Hand4.2-Gal4; Mito::GFP driver, 20 µm scale. (J–M) Fractional shortening results are displayed from 1-week-old females with manipulation of mitochondrial fission-fusion genes and Chchd3/6RNAiC1. (J) Chchd3/6 and Drp1 KD at 21 °C had little effect on their own, but in combination caused a reduction in fractional shortening, displaying a significant genetic interaction (Figure 3—figure supplement 1C). (K) At 25 °C Chchd3/6 KD reduced fractional shortening substantially, whereas Drp1 OE by itself or in combination with Chchd3/6RNAiC1 had no effect, thus no genetic interaction was observed (Figure 3—figure supplement 1F). (L) Even at 21 °C, Opa1 KD drastically reduced contractility, which in combination with Chchd3/6 KD slightly improved, which resulted in a significant genetic interaction (Figure 3—figure supplement 1I). (M) At 25 °C, Opa1 OE (M) had no effect, but in combination with Chchd3/6 KD contractility was further reduced significantly, although the interaction p-value did not reach significance (Figure 3—figure supplement 1L). One-way ANOVA with multiple comparisons shows mean with SEM and associated p-values. Sample size is shown at bottom of each bar.


