. 2023 Jul 5;12:e83385. doi: 10.7554/eLife.83385

Figure 6. Assessment of other MICOS subunits in the Drosophila heart.

(A) Schematic of the MICOS complex and SAM50. Human MICOS subunits and their respective Drosophila homologs are listed (image created with BioRender.com). (B) Fractional shortening measured from 1-week-old female flies with KD of individual MICOS subunits and Sam50 using a Hand4.2-Gal4 driver. Unpaired two-tailed t-test, ***p≤0.001, ****p≤0.0001; error bars represent SEM. (C) Hand4.2-Gal4, tdtK; ChchdD1/+ line was crossed out with ControlA. Unpaired two-tailed t-test, error bars represent SEM. (D) 1 week old F-actin-stained Drosophila hearts with or without heterozygous loss-of-function ChchdD1/+ in the background, 20 µm scale.

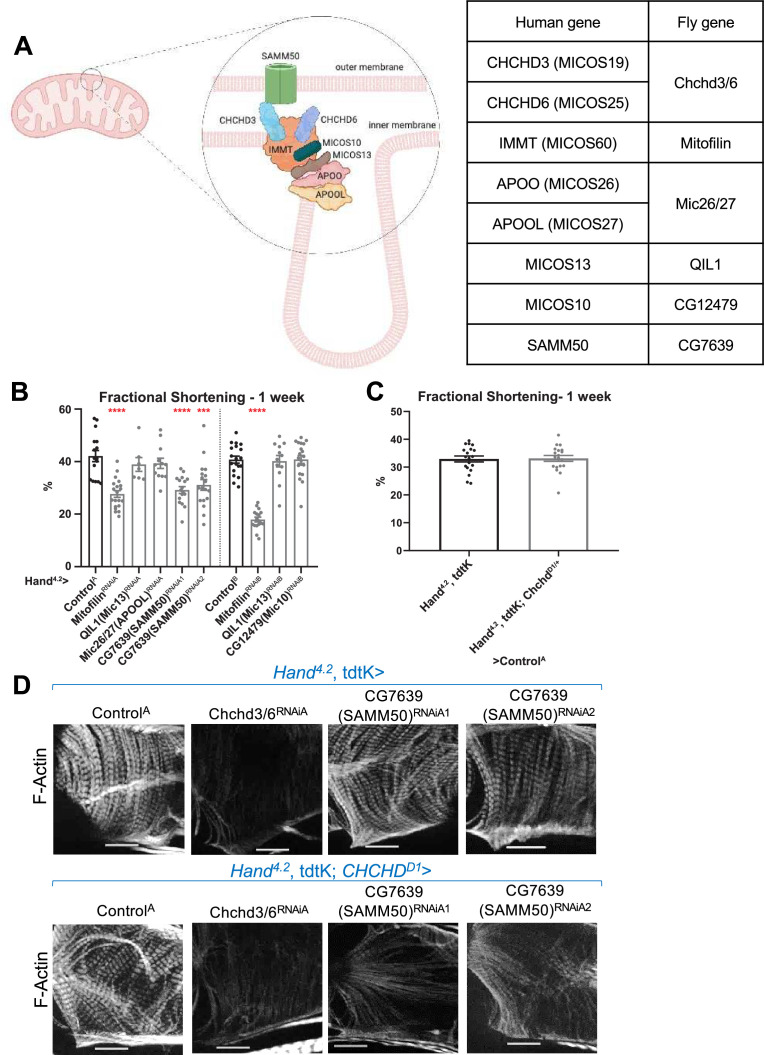
Figure 6—source data 1. Human MICOS subunits and their respective Drosophila homologs.

Figure 6.

Figure 6—figure supplement 1. Heart function and F-actin staining in flies with KD of other components of MICOS and SAMM50.

Figure 6—figure supplement 1.

(A) End-diastolic diameter and (B) End-systolic diameter measured from 1-week-old female flies with KD of individual MICOS subunits and CG7639 (SAMM50) using a Hand4.2-Gal4 driver. (C) F-actin cardiac sarcomere staining in 1-week-old female flies with Hand4.2-Gal4 KD. (D) All MICOS subunits and Sam50 were knocked down with Hand4.2-Gal4, tdtK (filled squares) or using the sensitizer line Hand4.2-Gal4, tdtK; ChchdD1/+ (empty squares) at 25 °C. Two-way ANOVA with Tukey’s multiple comparisons test, only statistical comparisons between same RNAi lines are shown; error bars represent SEM, 20 µm scale.
Figure 6—figure supplement 2. Cardiac cell proliferation and contractility assay following MICOS complex subunit KD.

Figure 6—figure supplement 2.

(A) VCMs showed reduced proliferation with siCHCHD6. (B) Quantification of proliferation between siRNA mediated KD of individual MICOS subunits and MICOS subunit combination KDs in VCMs (siTP53 is a positive control). One-way ANOVA with Dunnett’s multiple comparisons test, *p≤0.05, ***p≤0.001, ****p≤0.0001; error bars represent standard deviation. (C) OCR in hiPSC-vCMs after combo KD of CHCHD3 and CHCHD6 compared to control. (D&E) F-actin staining and fluorescence intensity along the F-actin fiber in combo KD of CHCHD3 and CHCHD6 compared to control.