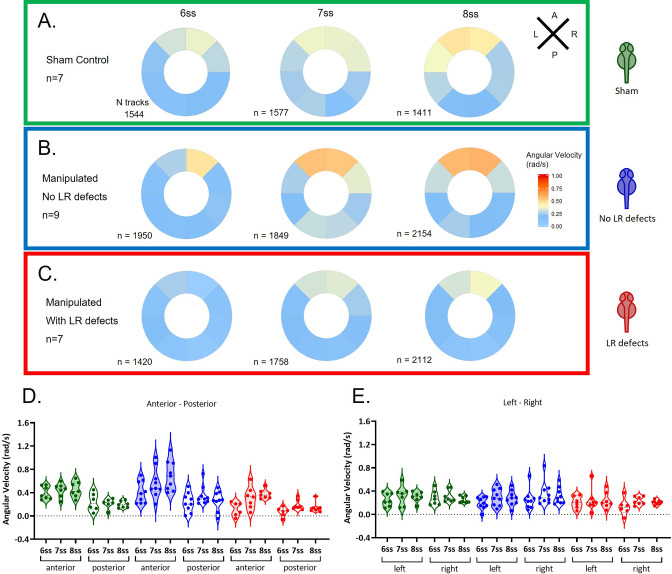
Figure 2. Angular velocity during LRO fluid flow recovery.
Angular velocity polar plots for 6 ss, 7 ss, and 8 ss for the three different groups (A) 'Sham’ control embryos colour coded in green, (B) ‘No LR Defects’ group of embryos colour coded in blue and (C) 'LR Defects’ group of embryos colour coded in red. LR defects refer to misplacement of heart or liver encountered at the larval stage after fluid extraction was performed at 5 ss; number of tracks refers to the number of particle trajectories identified for the quantifications and respective angular velocity plots. Colour code on polar plots refers to the median angular velocity for pooled embryos. (D–E) Violin plots showing quantifications of angular velocities found for the tracks analysed (D) anterior-posterior and (E) left and right. Dots contained in the violin plots correspond to median values per embryo. A statistical linear mixed effects regression was applied (see results in Table 1).


