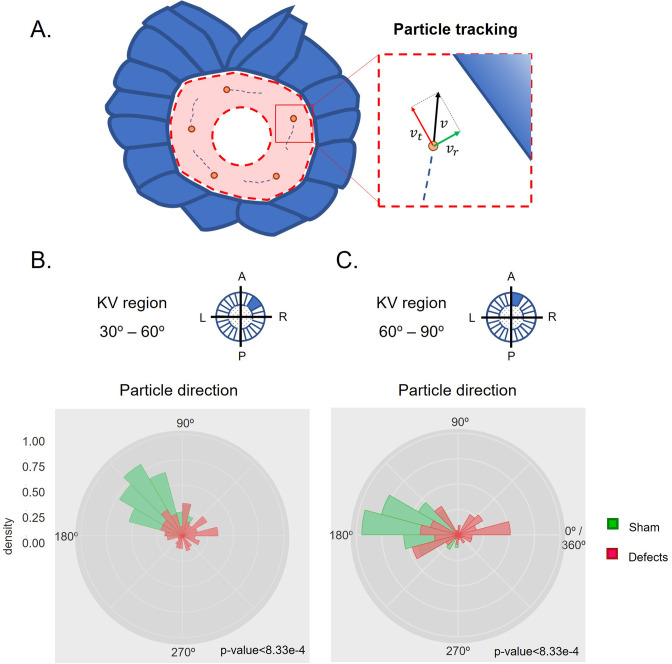
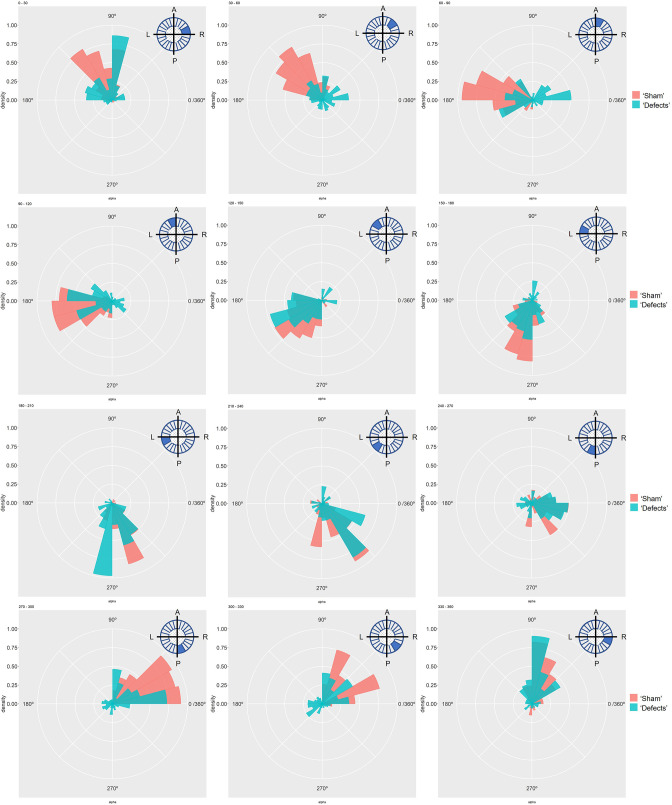
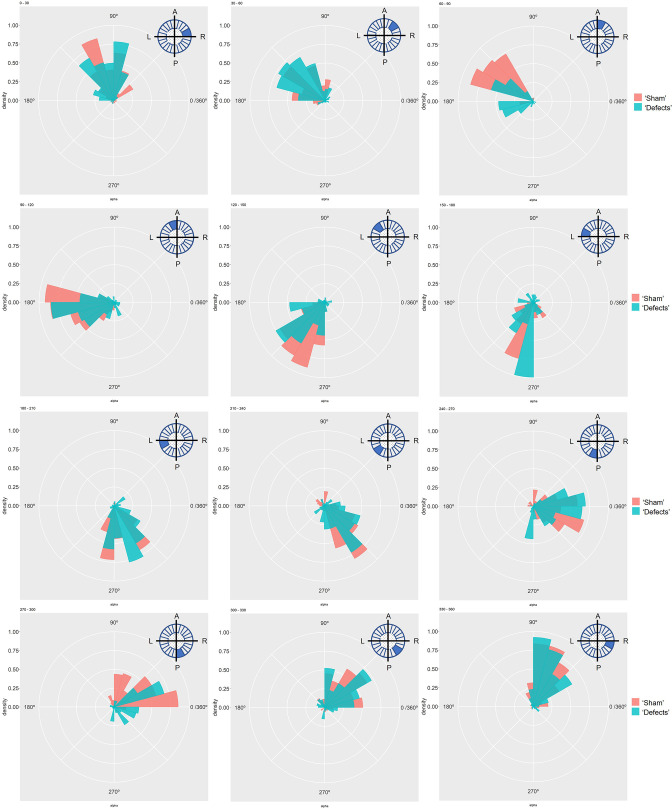
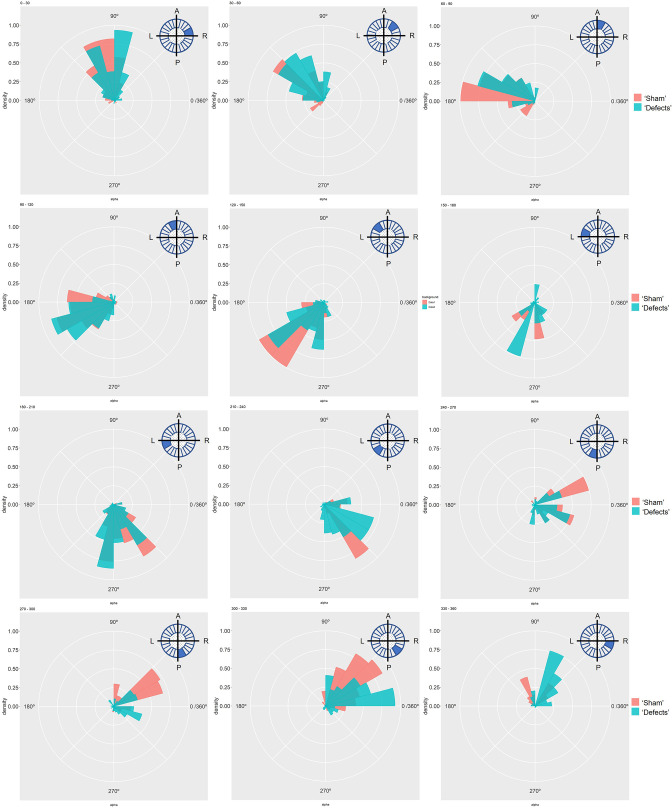
Figure 3. Directionality of vector fields changes in embryos that develop LR defects.
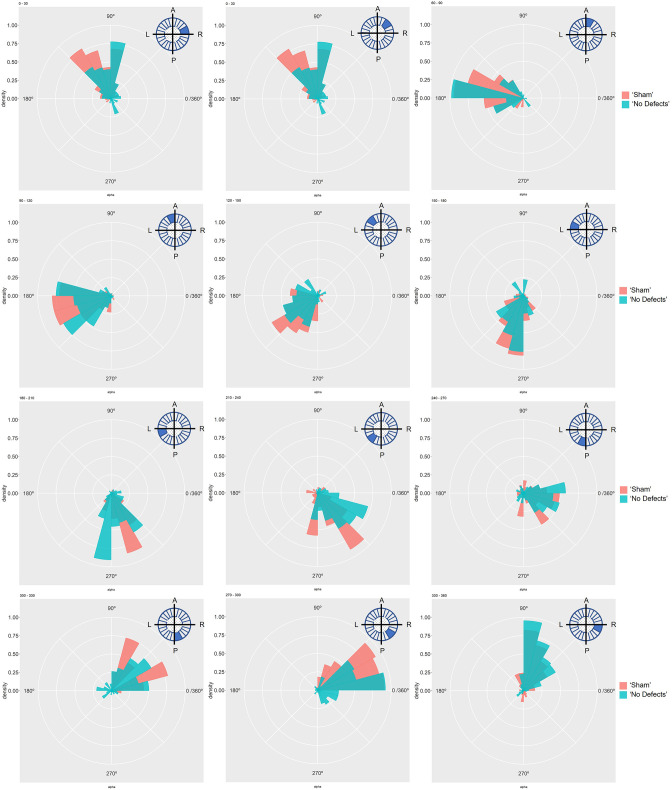
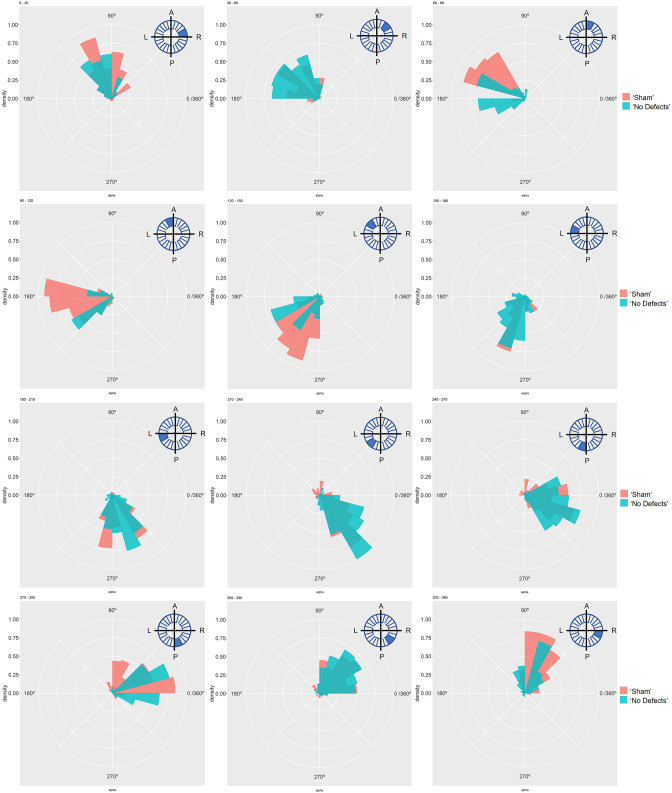
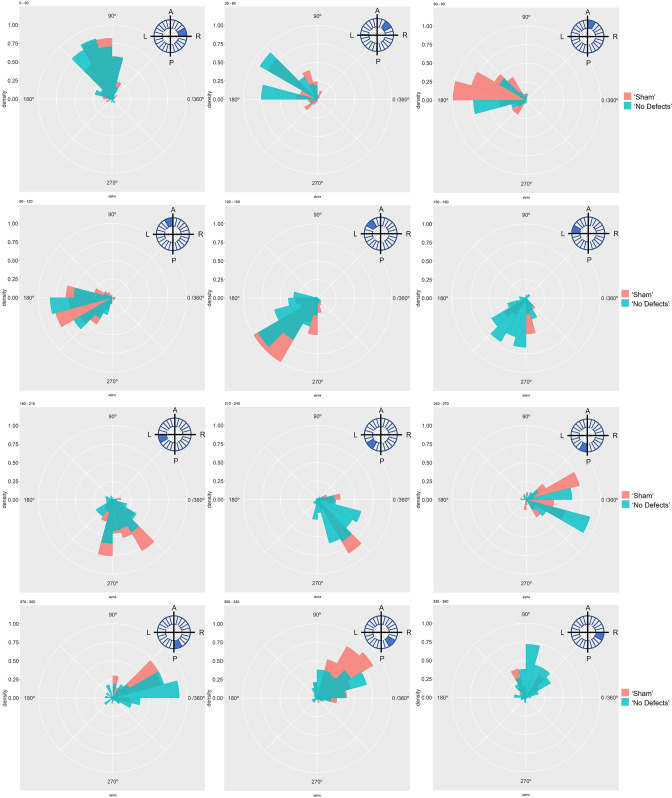
(A) Diagram representing particle directionality. LRO area sections were delimited based on intervals of 30 degrees. Highlighted are regions (B) from 30 to 60 degrees and (C) 60–90 degrees, that showed significant differences in particle movement between the groups ‘Sham’ control embryos and embryos with ‘LR Defects’. Each density plot represents the pooled tracked trajectory of all moving particles at any given point in time. Respective area region analysed is represented on the top right corner of each plot. To assess differences upon fluid manipulation ‘Sham’ and ‘Defect’ groups were plotted for the 6 ss. Kolmogrov-Smirnov test was used for comparing trajectory distribution between the two groups. Full data can be found in Figure 3—figure supplements 1–6.

