. 2023 Jul 21;12:e83861. doi: 10.7554/eLife.83861

Figure 4. LRO fluid dilution with physiological buffer has no negative impact on angular velocity.

(A) Diagram of the dilution experiment: KV fluid is extracted by a needle previously loaded with fluorescent rhodamine-dextran diluted in Danieau’s buffer (DB) that, after mixing of the two liquids, are re-injected into the LRO. (B) Example of a successfully micro-injected embryo labelled with fluorescent rhodamine-dextran. (C–D) Violin plots showing quantifications of angular velocities found for the tracks analysed (C) anterior-posterior and (D) left and right. Dots contained in the violin plots correspond to median values per embryo. A statistical linear mixed effects regression was applied (see results in Table 2).

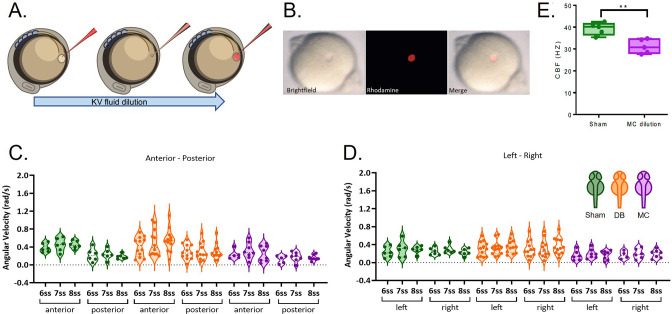
Figure 4—source data 1. Cilia beat frequency quantification during methylcellulose treatment.
Figure 4—source data 2. Angular velocity quantifications at 6, 7 and 8 somite stages after fluid extraction at 5 somite stage and replacement with normal or viscous Danieau buffer.

Figure 4.

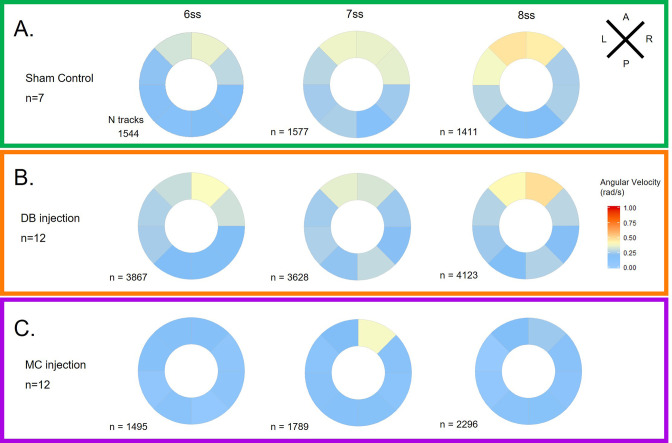
Figure 4—figure supplement 1. LRO flow dynamics is only affected when fluid dilution alters fluid viscosity (A) Angular velocity polar plots for 6 ss, 7 ss and 8 ss for the three different groups (A) 'Sham’ control, (B) 'DB dilution’ group and (C) 'MC dilution’ group.

Figure 4—figure supplement 1.

Number of tracks refers to the number of particle trajectories identified for the quantifications and respective angular velocity plots. Colour code on polar plots refers to the median angular velocity for all pooled embryos. LRO: left-right organizer. DB: Danieau buffer. MC: methylcellulose.
Figure 4—video 1. Close-up of fluid dilution technique employed in a 5 ss embryo.
Download video file (3.4MB, mp4)
Sequence of processed bright-field images acquired at ×10 magnification, showing the extracted liquid from the KV lumen being mixed with a previously loaded micropipette with Danieau’s buffer (related to Figure 4A–B).