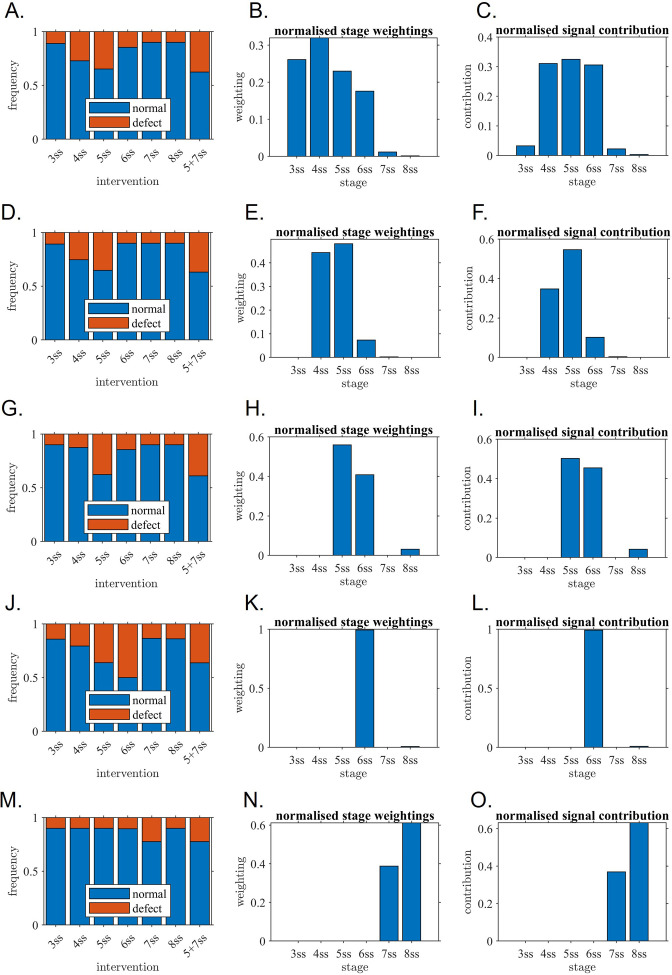
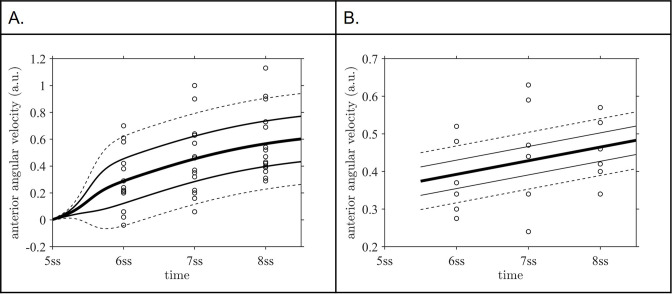
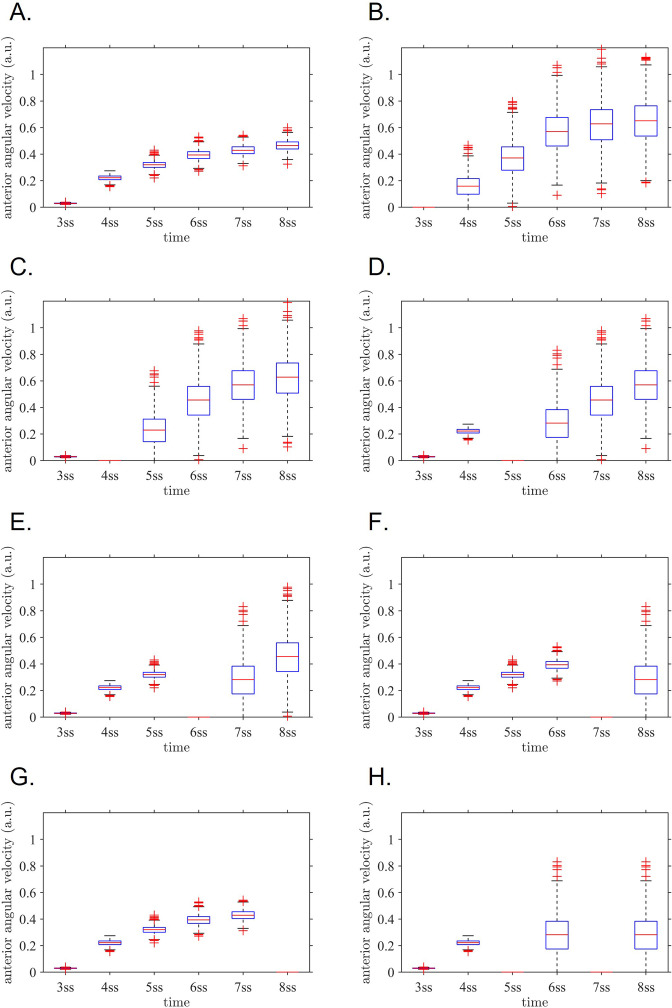
Figure 6. Mathematical modelling confirms the critical role of one-hour interval confirming the experimental observations.
Outcome of model fitting to experiment, associated stage weightings (sensitivity of KV to its own flow) and signal contribution (sensitivity multiplied by flow strength) for (A–C) Unrestricted model, (D–F) model with 3 ss contribution omitted, (G–I) model with 3–4 ss contributions omitted, (J–L) model with 3–5 ss contributions omitted, (M–O) model with 3–6 ss contributions omitted. The restricted models are included to assess alternative explanations for the data in which later stages still make a significant contribution. (A, D, G, J, M) fitted model outputs of rates of normal and abnormal situs for direct comparison with experiment; (B, E, H, K, N) fitted stage weightings (sensitivity of KV to its own flow) where tall bars mean ‘relatively more sensitive’ in arbitrary units, (C, F, I, L, O) signal contribution (sensitivity multiplied by flow strength) where tall bars mean ‘relatively more contribution’. The fitted restricted models for (G–I, J–L and M–O) do not fit the experiment well which confirms that they are unlikely to represent what is occurring in the KV. The fitted models for (A–C, D–F and G–I) have a much better fit and confirm that 5ss makes a major contribution, as do 4ss and/or 6ss. ss: somite stage.


