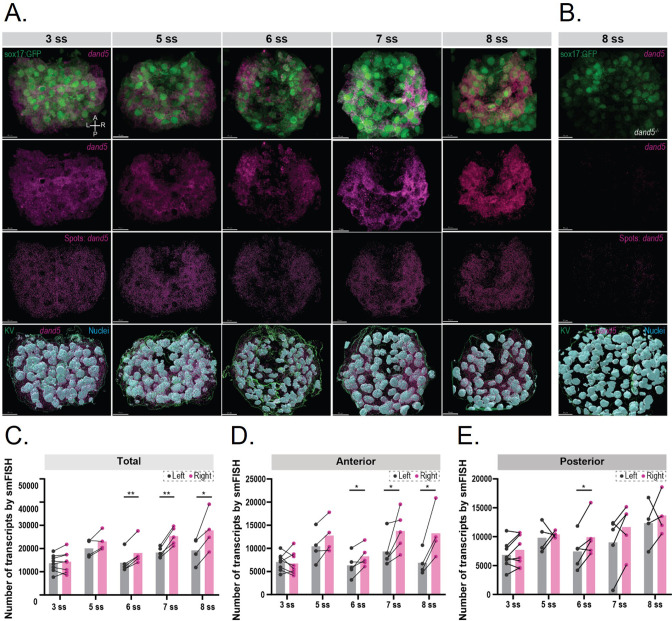
Figure 7. 3D smFISH and spatial analysis of dand5 mRNA transcripts in the KV.
(A) Time-course 3D analysis of dand5 mRNA transcripts by smFISH in Tg(sox17:GFP) embryos at 3, 5, 6, 7, and 8 somite stage (ss). 3D representations of dand5 mRNA (magenta), nuclei (cyan), and sox17:GFP (green) are shown. The KV surface (green) was used to mask both the dand5-Atto 565 and DAPI channels to remove nuclear staining. Spot detection was used to detect the dand5 cytoplasmic transcripts. Axes are indicated. Scale bar = 15 µm (B) The spot detection algorithm was validated in 8 ss dand5-/- embryos raised on the Tg(sox17:GFP) background. (C–E) Quantification of differences in the number of dand5 mRNA transcripts detected on the left and right sides of the KV; total number (C), at the anterior (D), and posterior (E) sides of the KV. Gray and magenta represent the left and right sides, respectively. Paired t-tests were used. The bars represent the mean values, and the dots represent individual embryos. Asterisks denote statistical significance: * corresponds to a p-value <0.05, and ** indicates a p-value <0.005.

