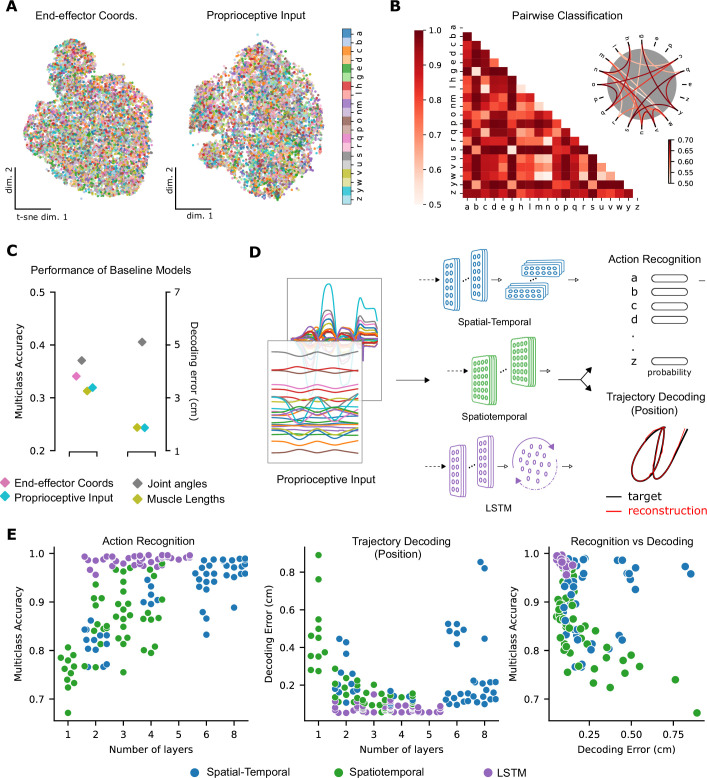
Figure 3. Quantifying action recognition and trajectory decoding task performance.
(A) t-Distributed stochastic neighbor embedding (t-SNE) of the end-effector coordinates (left) and proprioceptive inputs (right). (B) Classification performance for all pairs of characters with binary support vector machines (SVMs) trained on proprioceptive inputs. Chance level accuracy is 50%. The pairwise accuracy is 86.6 ± 12.5% (mean ± SD, pairs). A subset of the data is also illustrated as a circular graph, whose edge color denotes the classification accuracy. For clarity, only pairs with performance less than 70% are shown, which corresponds to the bottom 12% of all pairs. (C) Performance of baseline models: Multi-class SVM performance computed using a one-vs-one strategy for different types of input/kinematic representations on the action recognition task (left). Performance of ordinary least-squares linear regression on the trajectory decoding (position) task (right). Note that end-effector coordinates, for which this analysis is trivial, are excluded. (D) Neural networks are trained on two main tasks: action recognition and trajectory decoding (of position) based on proprioceptive inputs. We tested three families of neural network architectures. Each model is comprised of one or more processing layers, as shown. Processing of spatial and temporal information takes place through a series of one-dimensional (1D) or two-dimensional (2D) convolutional layers or a recurrent layer. (E) Performance of neural network models on the tasks: the test performance of the 50 networks of each type is plotted against the number of layers of processing in the networks for the action recognition (left) and trajectory decoding (center) tasks separately and against each other (right). Note we jittered the number of layers (x-values) for visibility, but per model it is discrete.


