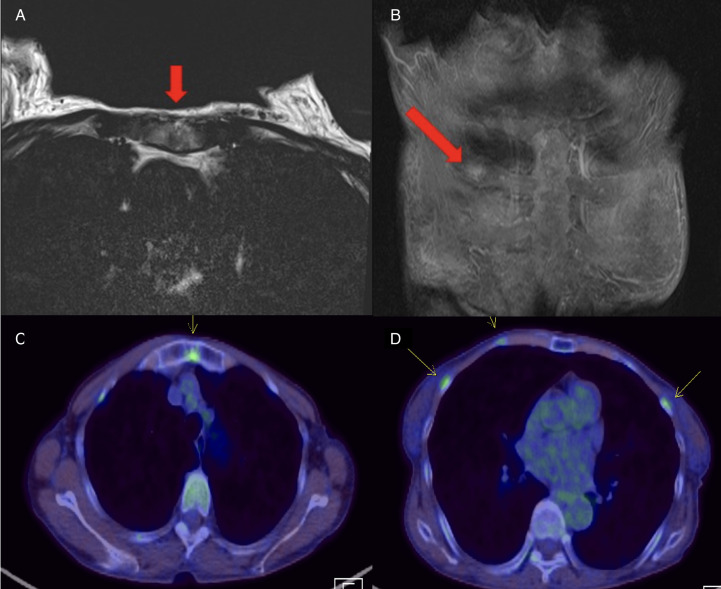
Figure 3.
(A, B) Chest MRI scans. Red arrows indicate high-signal-intensity lesions at the sternum and right third rib. (C, D) PET-CT scans. Yellow arrows indicate multiple FDG uptakes in the sternum and ribs. High-signal-intensity lesions on MRI were consistent with lesions with FDG uptake on PET-CT. MRI, magnetic resonance imaging; PET-CT, positron emission tomography–computed tomography; FDG, fluorodeoxyglucose.

