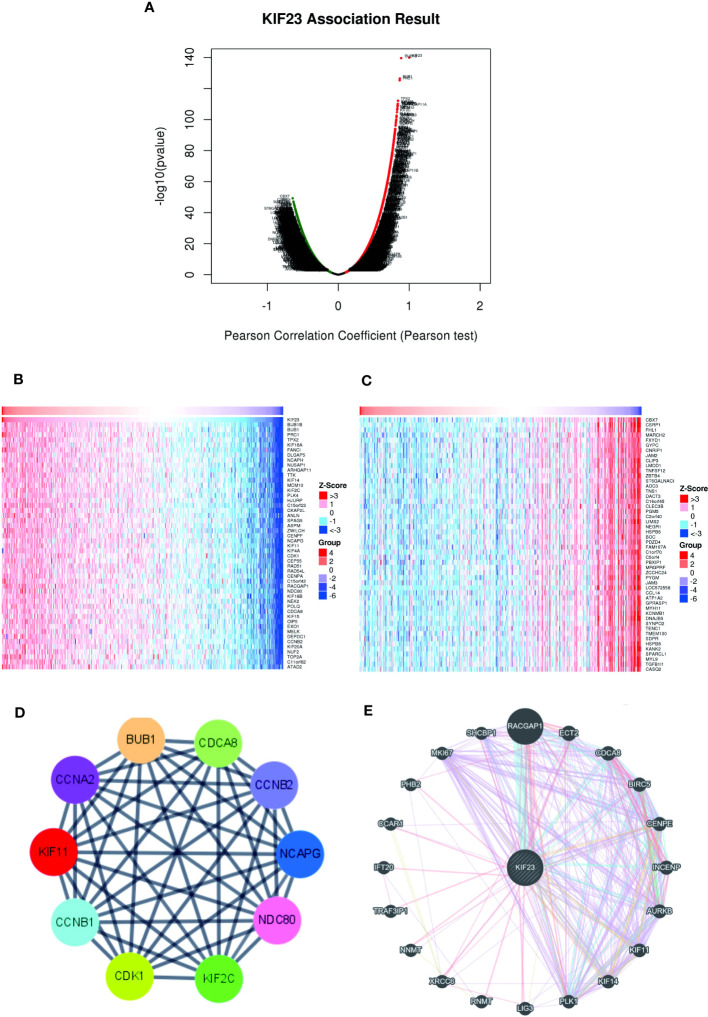
Figure 3.
Co-expressed genes and PPI Network analysis of KIF23. (B, C) Heatmaps indicate the top 50 genes positively and negatively correlated with KIF23 in GC by LinkedOmics. (A) Correlations between KIF23 and differentially expressed genes in GC. (D) The top 10 hub genes. (E) PPI network analyzed by GeneMANIA.

