
Figure 6.
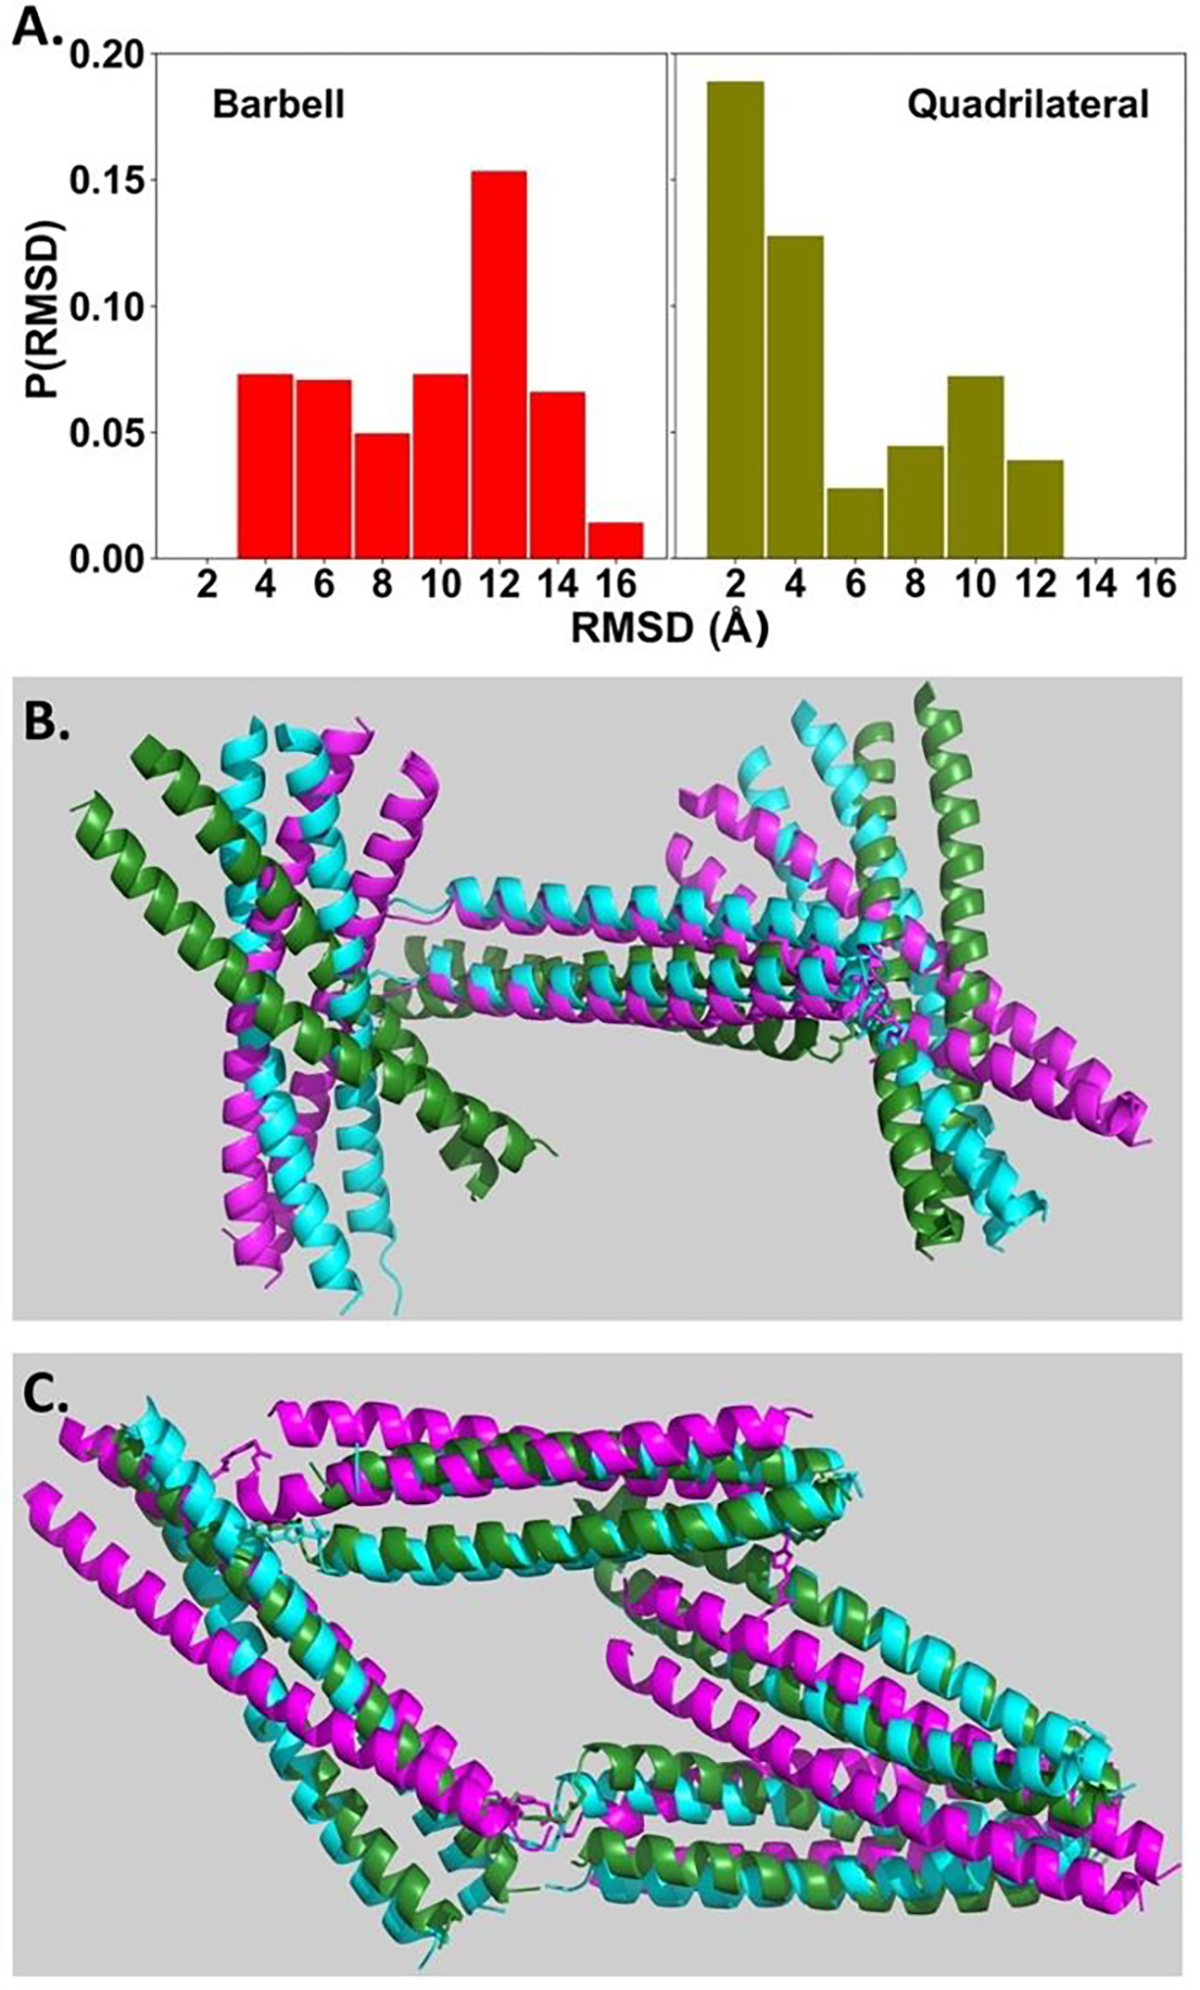
(A) Histogram plots of Cα-RMSD values of all Molecular Dynamics models that could fit the experimental SAXS data of barbell (left) and quadrilateral (right) shaped assemblies. Three different models of barbell (B) and quadrilateral (C) shaped assemblies are overlaid. The cyan-coloured model was used as the reference for calculating Cα-RMSD values. The green- and magenta-coloured representative models show the median and largest Cα-RMSD values, respectively. (See Figure S35–S38, Amination S1-S2 and supplementary pse files for more details of analysis.)