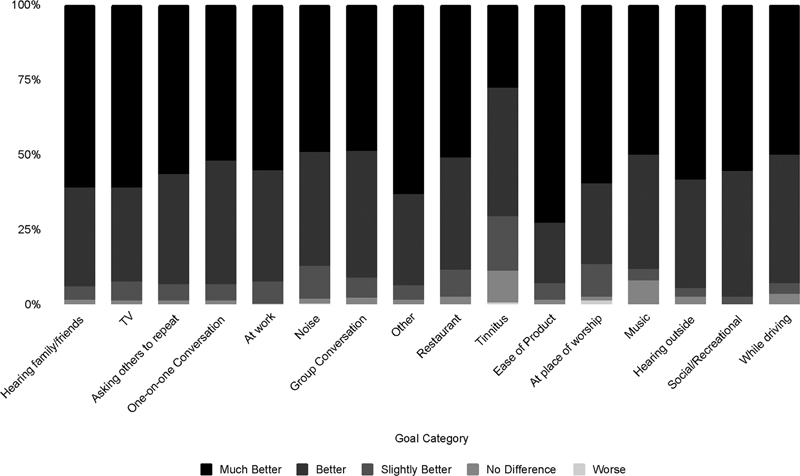
Figure 11.

Post-fitting Client Oriented Scale of Improvement results as a function of specific problem situations averaged across all clients. The degree of change is represented by the column segment shade ranging from light gray (worse) to much better (black).
