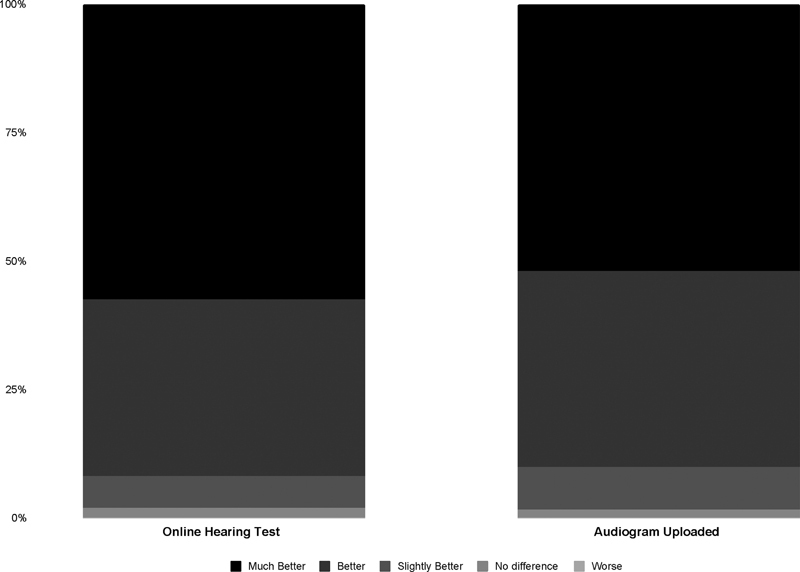
Figure 12.

Comparison of post-fitting Client Oriented Scale of Improvement results averaged across all clients and situations as a function of audiogram type. Data for those clients for whom their online hearing test was used to program their hearing aids are shown in the left column; those for whom their uploaded audiogram was used to program their hearing aids are shown in the right column. The degree of change is represented by the column segment shade ranging from light gray (worse) to much better (black).
