
Fig. 3.
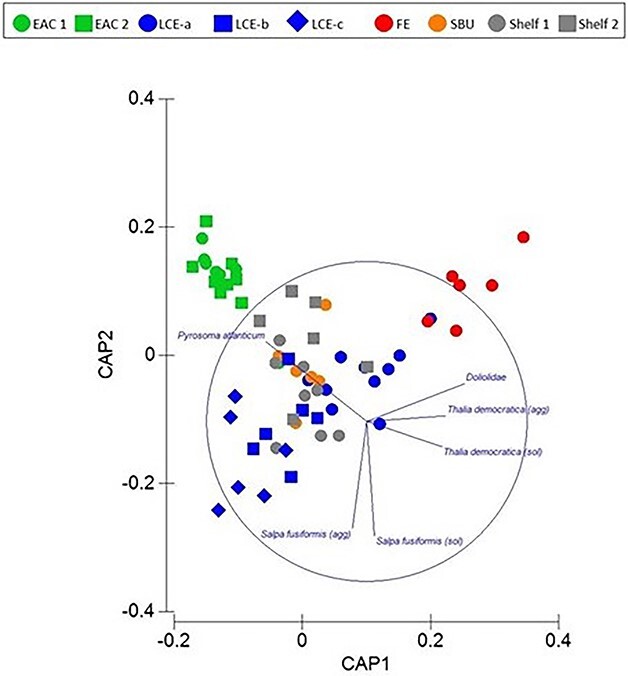
Spring 2019. Constrained CAP analysis illustrating relationships among thaliaceans and oceanographic features and stations (δ2 = 0.8835; m = 7; LoA = 60.317%). EAC = East Australia Current; LCE = large cyclonic eddy; SBU = shelf break upwelling; FE = frontal eddy.