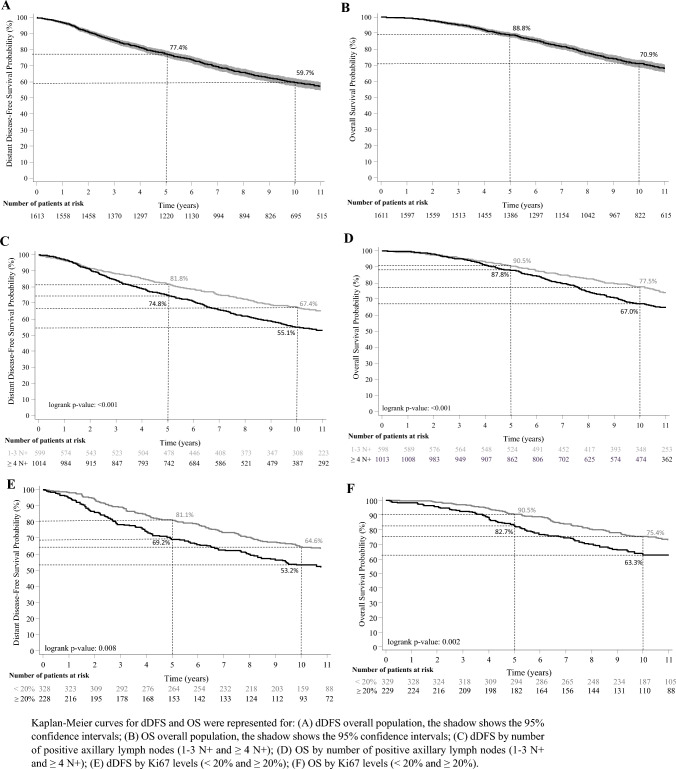
Fig. 3.
Distant Disease-free Survival (dDFS) and Overall Survival (OS) from the start of adjuvant ET. A. dDFS overall population; B. OS overall population C. dDFS by number of positive axillary lymph nodes (1–3 N + and ≥ 4 N +); D. OS by number of positive axillary lymph nodes (1–3 N + and ≥ 4 N +); E. dDFS by Ki67 levels (< 20 and ≥ 20%); F. OS by Ki67 levels (< 20 and ≥ 20%). Kaplan–Meier curves for dDFS and OS were represented for: (A) dDFS overall population, the shadow shows the 95% confidence intervals; (B) OS overall population, the shadow shows the 95% confidence intervals; (C) dDFS by number of positive axillary lymph nodes (1–3 N + and ≥ 4 N +); (D) OS by number of positive axillary lymph nodes (1–3 N + and ≥ 4 N +); (E) dDFS by Ki67 levels (< 20 and ≥ 20%); (F) OS by Ki67 levels (< 20 and ≥ 20%)

