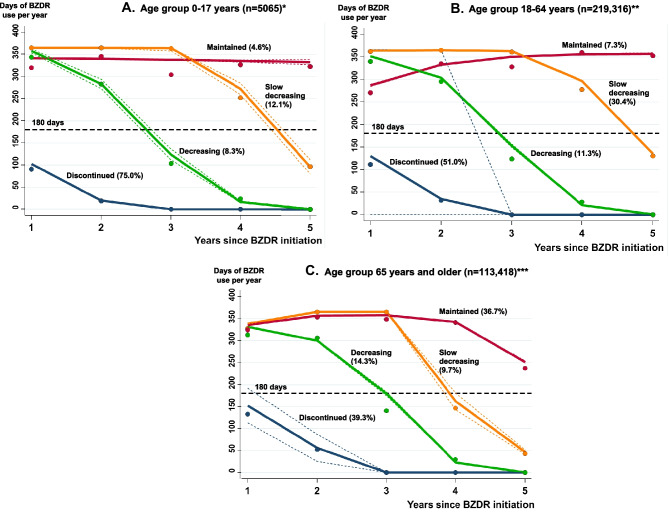
Fig. 2.
The trajectory models of predicted probability of BZDR use (solid lines) with 95% confidence intervals (short-dashed lines) over 5-year period within the age group of 0–17 years at the treatment initiation (A), 18–64 years (B), and 65 years and older (C), built by group-based trajectory modelling. Note: Proportions reported next to each trajectory name denote the proportions of BZDR-recipients assigned to each trajectory-group (i.e., observed values). * For 0–17 year age group, the number of BZDR-recipients assigned to each trajectory-group and the corresponding proportions (in parentheses) as well as the proportions of estimated probability of group membership, i.e., predicted values [in brackets] are as the following: the ‘Discontinued’ trajectory n = 3798 (75.0%) [74.5%], the ‘Decreasing’ trajectory n = 420 (8.3%) [8.8%], the ‘Slow decreasing’ trajectory n = 614 (12.1%) [11.9], and the ‘Maintained’ trajectory n = 233 (4.6%) [4.8%]. ** For 18–64 year age group, the number of BZDR-recipients assigned to each trajectory-group and the corresponding proportions (in parentheses) as well as the proportions of estimated probability of group membership, i.e., predicted values [in brackets] are as the following: the ‘Discontinued’ n = 111,959 (51.0%) [50.5%], the ‘Decreasing’ n = 24,707 (11.3%) [12.1%], the ‘Slow decreasing’ n = 66,625 (30.4%) [29.6%], and the ‘Maintained’ n = 16,025 (7.3%) [7.8%]. *** For the age group of ≥ 65 years, the number of BZDR-recipients assigned to each trajectory-group and the corresponding proportions (in parentheses) as well as the proportions of estimated probability of group membership, i.e., predicted values [in brackets] are as the following: the ‘Discontinued’ n = 44,525 (39.3%) [38.5%], the ‘Decreasing’ n = 16,220 (14.3%) [15.5%], the ‘Slow decreasing’ n = 11,014 (9.7%) [9.9%], and the ‘Maintained’ n = 41,659 (36.7%) [36.2%]

