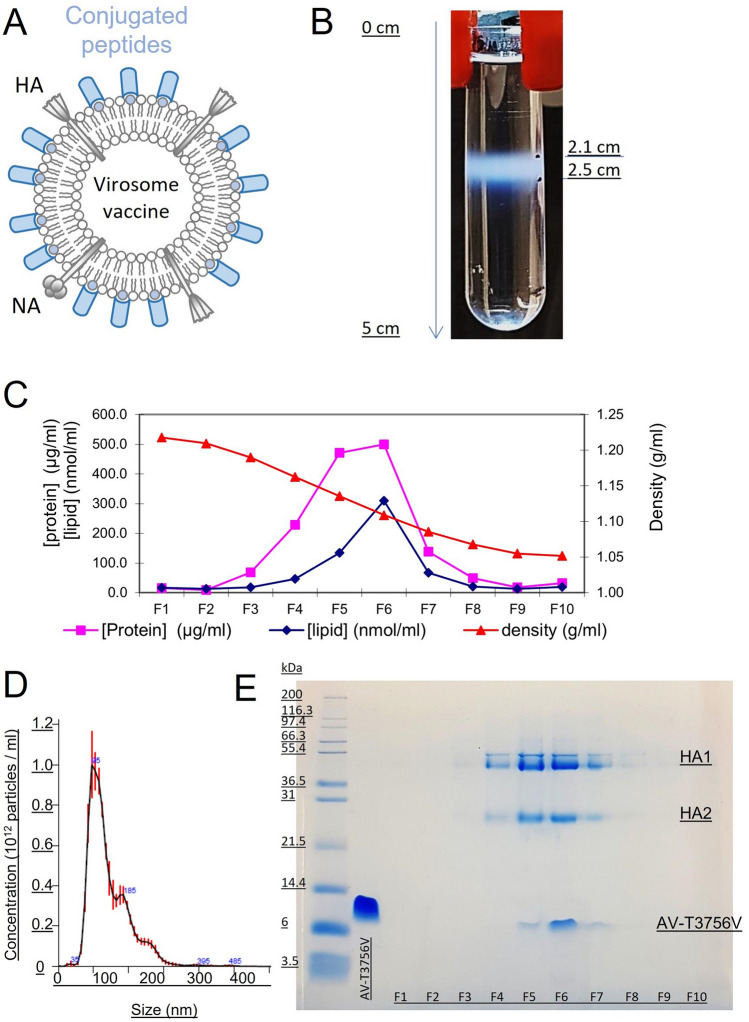
Fig. 1.
Equilibrium density sucrose gradient analysis of virosomes. Schematic diagram of virosomes, showing the viral membrane lipids, viral proteins HA and NA, and the Amplivant-, or lipid conjugated peptide A. Virosomes were spun at 120.000 g for 64 h in a 10–60% sucrose gradient, showing a single band B with a density of around 1.1 g/ml. Fractions C were taken from bottom (left) to top and assayed for protein, lipid (phosphate) and sucrose concentration (converted to density) and by SDS-PAGE gel E, AV-T3756V is the Amplivant-conjugated SLP (left, fractions to the right), HA1 and HA2 are the subunits of influenza hemagglutinin. The size distribution of the virosomes D was measured by single particle tracking sizing analysis (Nanosight®)

