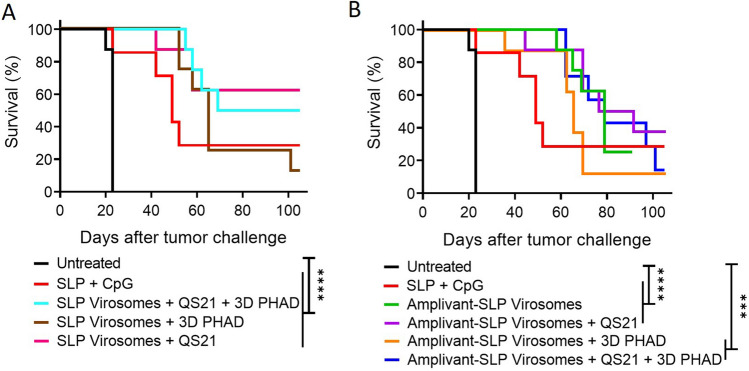
Fig. 7.
Kaplan–Meier graphs of the survival of mice shown in Fig. 6. A Amplivant-SLP virosomes vs. untreated mice and mice vaccinated with SLP and CpG. B Lipid-linked SLP virosomes vs. the same controls. Significant differences (log rank test): all virosome groups vs. untreated animals (p < 0.0001, except Amplivant-SLP virosomes + 3D PHAD p = 0.0001 and Amplivant-SLP virosomes + QS-21 + 3D-PHAD p = 0.0003). The differences between virosome groups were not significant, and the differences between virosome groups and SLP + CpG and Montanide were also not significant. *p < 0.05, **p < 0.01, ***p < 0.001, ****p < 0.0001

