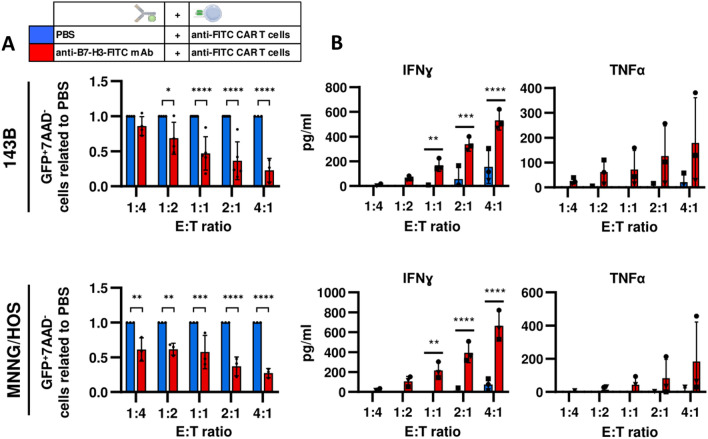
Fig. 2.
Antitumor activity of anti-FITC CAR T cells. GFP-expressing tumor cells stained (anti-B7-H3-FITC mAb, red) or not (PBS, blue) are cocultured with resting anti-FITC CAR T cells at different effector: target (E:T) ratios for 48 h. A Living tumor cells (CD45−GFP+7AAD−) are determined by flow cytometry. The normalization of anti-B7-H3-FITC mAb to PBS is shown. B IFNɣ and TFNα levels are tested by ELISA in the cocultured supernatants. All data are represented as mean ± SD of independent experiments with CAR T cells from at least 3 different donors. *, P < 0.05; **, P < 0.01; ***, P < 0.001; ****, P < 0.0001 by two-way ANOVA with Sidak post hoc test

