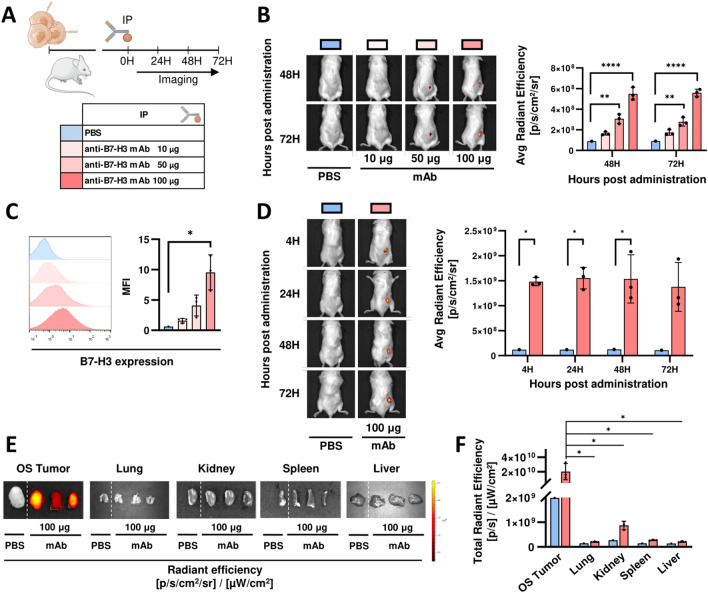
Fig. 3.
anti-B7-H3 mAb biodistribution in a NSG mice model. A Schematic representation of experimental design. PBS or different doses of anti-B7-H3 mAb (clone 8H9) labeled with Alexa Fluor 647 is administrated by intraperitoneal injection (IP) to NSG mice-bearing 143B tumors. B and D Tumors are imaged at different time points using IVIS imaging system. Representative IVIS image and mean ± SD of average radiant efficiency are shown. *, P < 0.05; **, P < 0.01; ***, P < 0.001 by two-way ANOVA with Tukey (B) and Sidak (D) post hoc test. C B7-H3 expression on ex vivo tumor cells is evaluated by flow cytometry at 72 h. Solid histograms (left) represent the expression of B7-H3 on 143B cells. One representative profile per group is shown. Graph (right) shows the mean fluorescence intensities (MFI) mean ± SD of at least 3 mice. **, P < 0.01; by one-way ANOVA with Tukey post hoc test. E Ex vivo imaging of OS tumors and the organs indicated after 72 h of PBS or anti-B7-H3 Alexa Fluor 647 administration. F Quantification of total radiant efficiency of ex vivo imaging (mean ± SD) *, P < 0.05 by two-way ANOVA with Sidak post hoc test

