
Fig. 4.
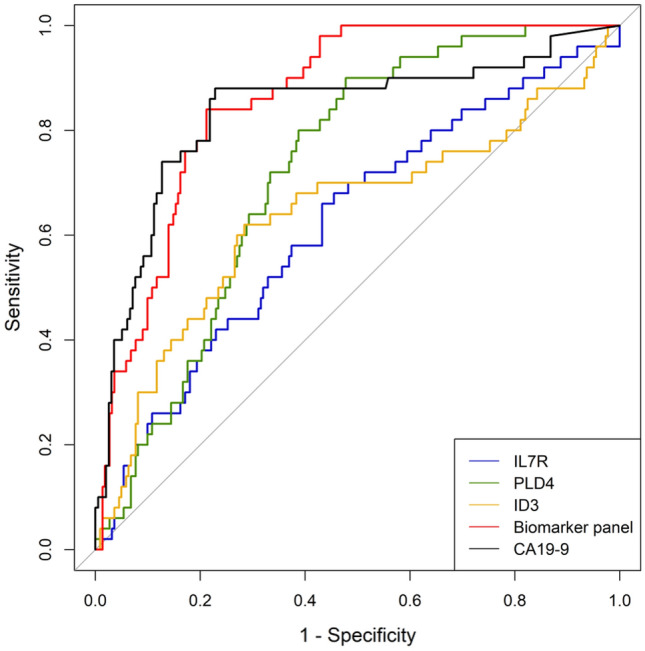
ROC curves for CA19-9, PLD4, IL-7R, ID3, and the biomarker panel for PDAC assessment. The AUC for the biomarker panel was significantly higher than that for IL-7R, PDL4, and ID3 individually. The AUC for CA19-9 did not differ from that of the biomarker panel. ROC, receiver operating characteristics; PDAC, pancreatic ductal adenocarcinoma; AUC, area under the curve; CA19-9, carbohydrate antigen 19–9; IL-7R, interleukin-7 receptor; PLD4, phospholipase D 4; ID3, inhibitor of DNA binding 3