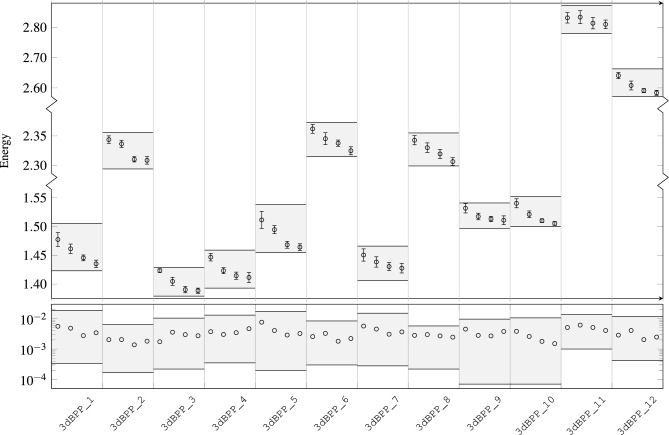
Figure 5.
Top: mean energy values with their corresponding standard deviation for the 10 runs belonging to each instance. From left to right on each instance, the time limits given to the solver are , , and . Numbers placed above and below the shaded areas show the mean QPU access time for every time limit within each instance (in units of nanoseconds). Bottom: using (28), deviation around the mean energy of the results depicted above. For both plots, shaded area shows the region where the minimum and maximum values fell during the study.

