
Fig. 2. Growth dynamics of untreated and post-treatment relapsing BMs that successfully met the sensitivity analysis criteria.
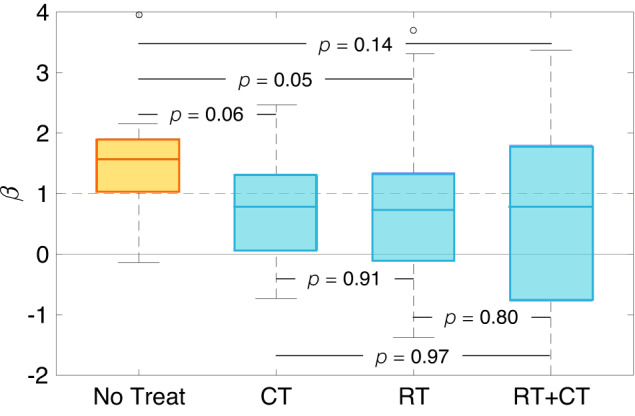
Box plots comparing the growth exponents β of the different groups after a sensitivity analysis: untreated (n = 9), growing during chemotherapy treatment (CT, n = 14), recurrent BMs receiving only radiation therapy (RT, n = 27), or both (RT+CT, n = 29). p-values correspond to the Kruskal–Wallis test. The boxplots depict the median (center line), interquartile range (bounds of the box), the range of typical data values (whiskers, extending 1.5 times the interquartile range), and outliers (represented by circles).