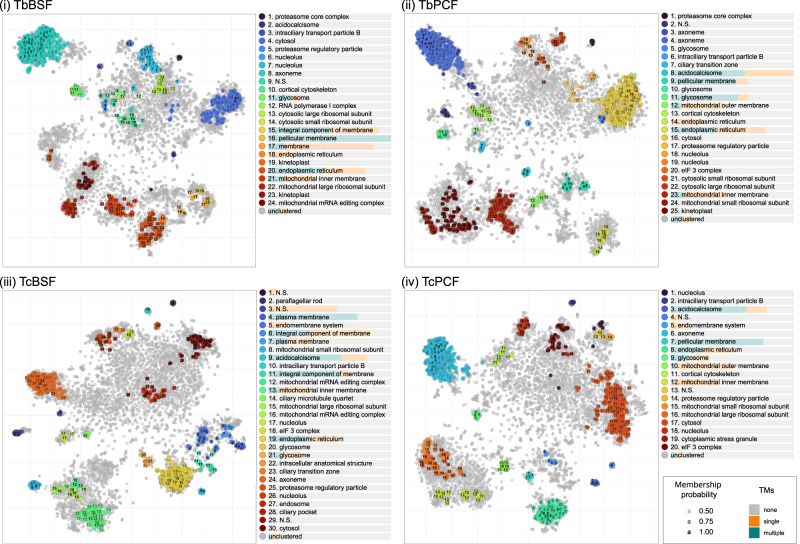
Fig. 2. Feature analysis of unsupervised clusters generated with HDBSCAN demonstrates resolution of distinct subcellular functional compartments in each dataset.
HDBSCAN clusters were highlighted on t-SNE projections for (i) T. brucei BSF, (ii) T. brucei PCF, (iii) T. congolense BSF and (iv) T. congolense PCF. Significantly represented GO CC terms in each cluster are displayed in the legend associated with each t-SNE projection (N.S. = not significant, with no significantly represented terms). The proportional representation of predicted single or multiple TM domains among proteins in each cluster is displayed below each cluster name in the associated legend.

