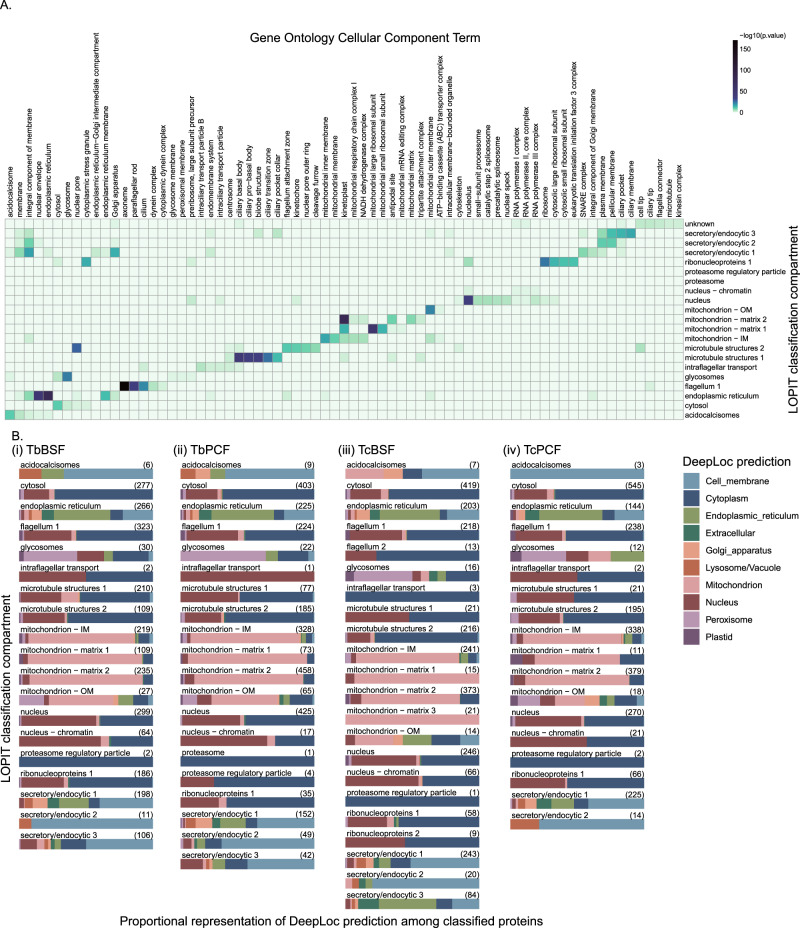
Fig. 4. Correlation of TAGM-MAP classifications with orthogonal approaches.
A Heatmap of GO CC term representation in TAGM-MAP classifications for T. brucei BSF. hyperLOPIT compartments are on the Y-axis, GO CC terms are on the X-axis, colours are scaled by the −log10 (p-value) for the over-representation of GO CC terms in the indicated compartment versus the background proteome. B DeepLoc subcellular compartment predictions visualised with bar-plots proportionally, grouped according to compartment for (i) T. brucei BSF, (ii) T. brucei PCF, (iii) T. congolense BSF and (iv) T. congolense PCF. Total number of classified proteins for each compartment is indicated on the right.

