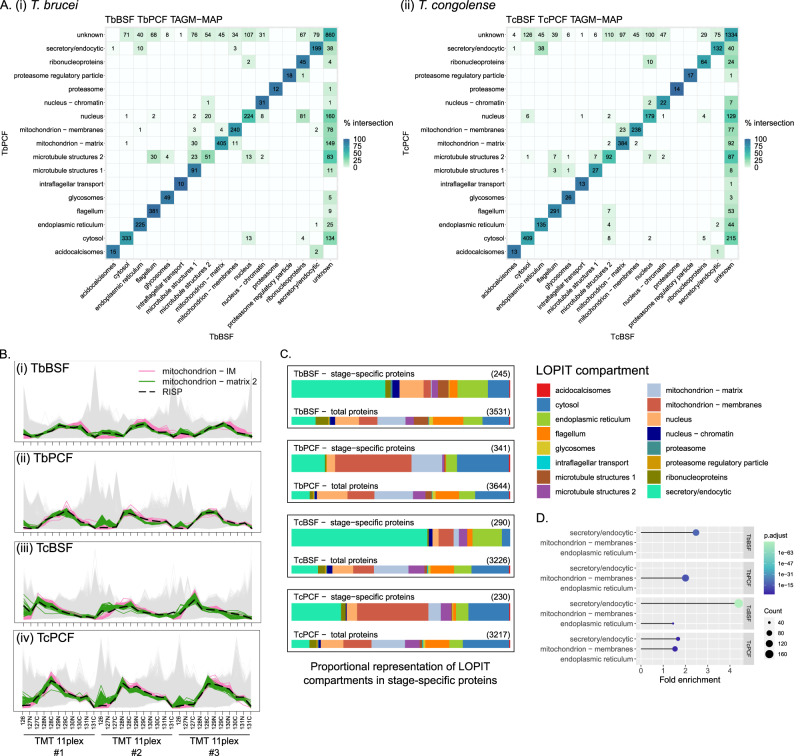
Fig. 5. Comparative analysis of spatial proteomes between life-stages within species.
A Heatmap of the agreement between compartments common proteins in (i) T. brucei BSF and PCF, and (ii) T. congolense BSF and PCF. Tile colour is scaled by the agreement between life-stages. B Abundance distribution profile for RISP in (i) T. brucei BSF, (ii) T. brucei PCF, (iii) T. congolense BSF and (iv) T. congolense PCF relating allocation to either mitochondrion – matrix in BSFs or IM in PCFs. C Proportional representation of compartments in stage-specific proteins visualised on bar-plots for indicated cell-type. D Lollipop chart showing the fold enrichment for over-represented compartments in stage-specific proteins for indicated cell-type. Circle size is scaled by count of proteins in indicated compartment and colour by p-value for the over-representation of compartment versus the background proteome. Enrichment analysis was performed using clusterProfiler (v4.0.5) ‘enricher’ function with default settings (hypergeometric test p < 0.05 with Benjamini and Hochberg adjustment).

