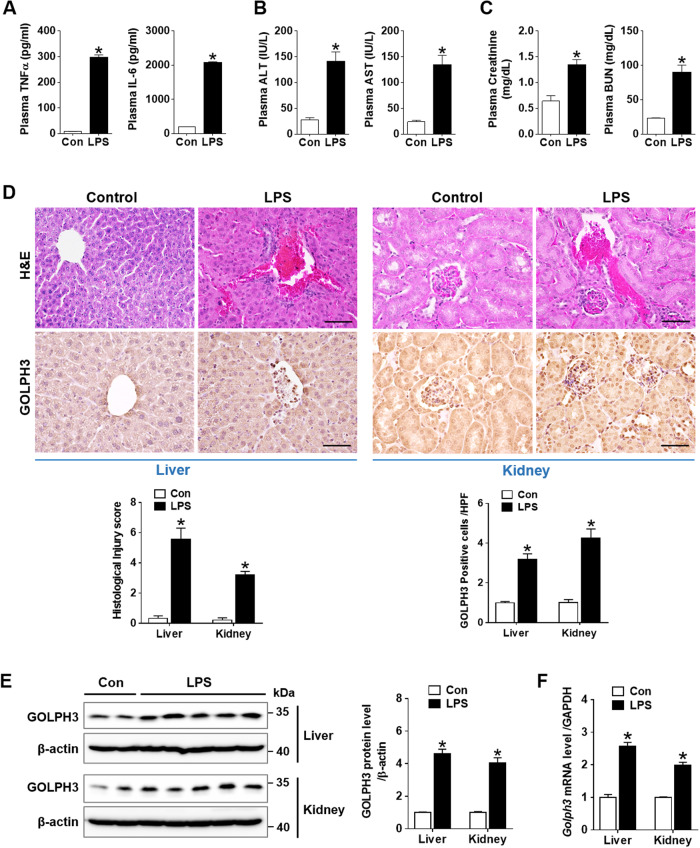
Fig. 1. GOLPH3 is upregulated in endotoxemia-induced acute liver and kidney injury in mice.
C57BL/6 mice were intraperitoneally injected with a single dose of LPS (20 mg/kg) or normal saline (control) and sacrificed at 18 h post injection. Blood, liver, and kidney tissue samples were collected at sacrifice. A Plasma TNFα and IL-6 cytokine production was determined by ELISA. B, C Plasma liver and kidney injury parameters (ALT, AST, Creatinine, and BUN) were measured respectively with a spectrophotometer (n = 4–6). D Representative images of histopathological changes are shown by H&E staining (upper panel) and GOLPH3 immunostaining (lower panel) in liver and kidney tissues. The extent of liver or kidney damage was evaluated and graded as described in the method section, while GOLPH3-positive cells/high power field (HPF) were assessed and counted (n = 3–5). Scale bar, 100 µm. E Western blot analysis and quantification of GOLPH3 protein levels over β-actin as a loading control (n = 3–5). F Relative mRNA levels of GOLPH3 were examined using real-time PCR analysis in liver and kidney tissues, and relative mRNA expression was normalized to that of GAPDH (n = 3–5). The data are presented as mean ± SEM. Two-tailed Student’s t-test was used, *p < 0.05 versus Control.

