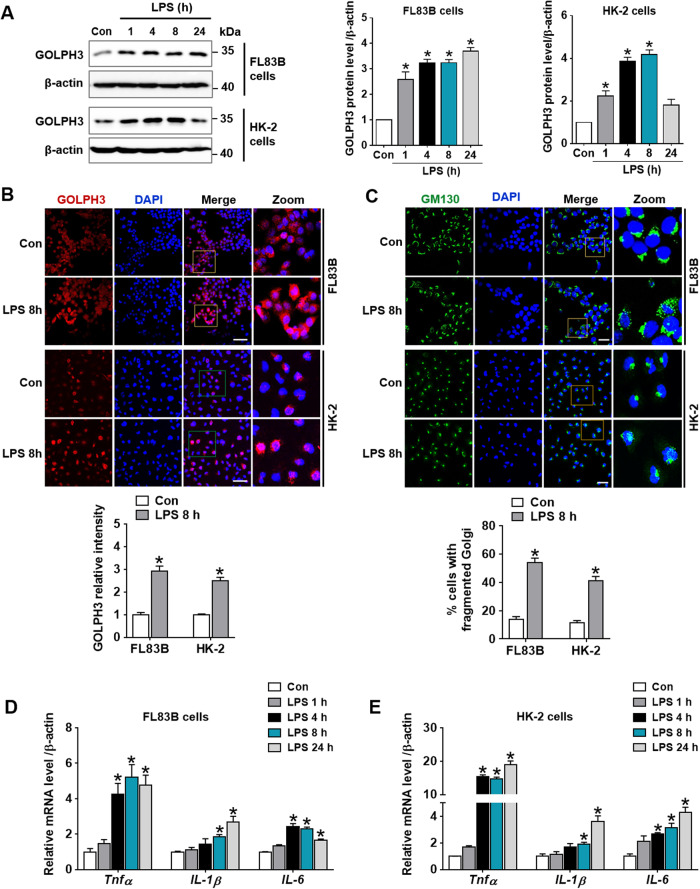
Fig. 3. Upregulation of GOLPH3 by LPS treatment is associated with Golgi stress and inflammatory response in vitro.
A Hepatocytes (FL83B) and renal proximal tubule cells (HK-2) were treated with LPS (1 µg/ml) for different time points as indicated. The protein expression levels of GOLPH3 were assessed by western blot analysis, and the quantification results are shown (n = 3). B The cells were treated with LPS (1 µg/ml) for 8 h, representative images of immunofluorescence staining of GOLPH3 (red) were analyzed by confocal microscopy and relative GOLPH3 intensity were quantified (n = 3). Scale bar, 50 µm. C Immunofluorescence staining of GM130 (green) was performed to examine the Golgi morphology. The representative immunofluorescence staining images of GM130 were examined using confocal microscopy. Relative cells with abnormal and fragmented Golgi were quantified (n = 3). Scale bar, 20 µm. D, E Relative mRNA levels of pro-inflammatory cytokines (Tnfα, IL-1β, and IL-6) were examined by real-time PCR analysis in FL83B and HK-2 cells, respectively; and relative mRNA expression of each gene was normalized to that of GAPDH (n = 3). The data are presented as mean ± SEM. One-way ANOVA, followed by Bonferroni’s multiple comparisons was used, *p < 0.05 versus Control.

