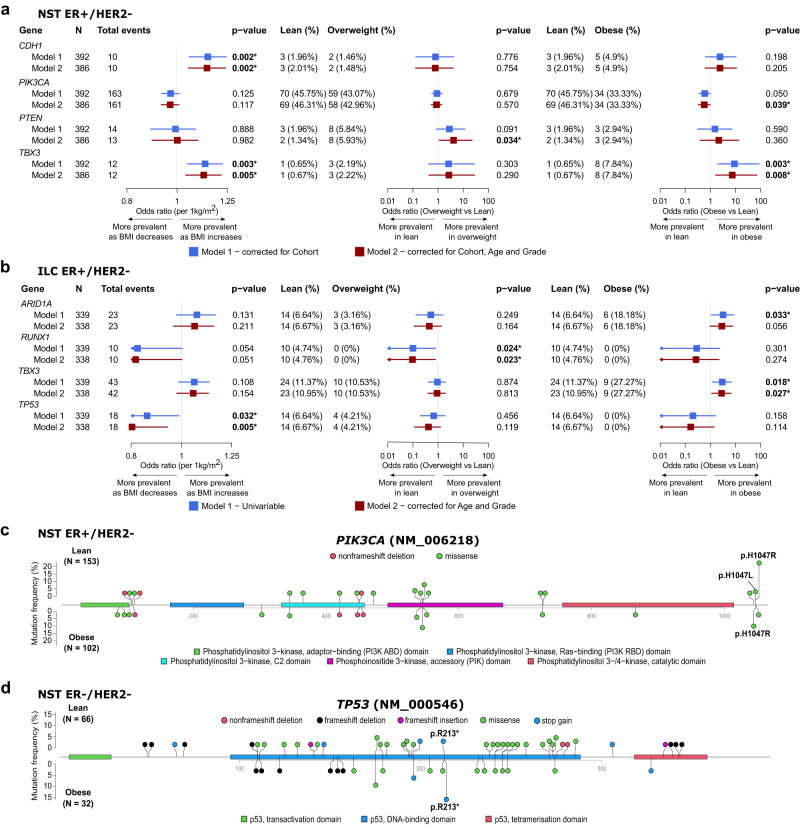
Fig. 1. Association of BMI with oncogenic mutations of breast cancer-specific driver genes in patients from the METABRIC, ICGC, and ELBC cohorts.
a, b Forest plots showing the associations evaluated using Firth’s logistic regression with p value < 0.05 between BMI, either as a continuous variable or a categorical variable (overweight vs lean, and obese vs lean), and driver gene mutations in patients with NST ER+/HER− (a) and ILC ER+/HER2− (b). Color-coded boxes indicate point estimates of odds ratios, and whiskers indicate their corresponding 95% confidence intervals. All statistical tests were two-sided. p values shown were not corrected for multiple testing. c, d Lollipop plots presenting the location and frequency of oncogenic mutations occurring in the PIK3CA gene in tumors from lean (top) and obese (bottom) patients in the NST ER+/HER2− subgroup (c), the TP53 gene in the NST ER−/HER2− subgroup (d). All statistical tests were two-sided. p values shown were derived from Fisher’s exact tests and not corrected for multiple testing.

