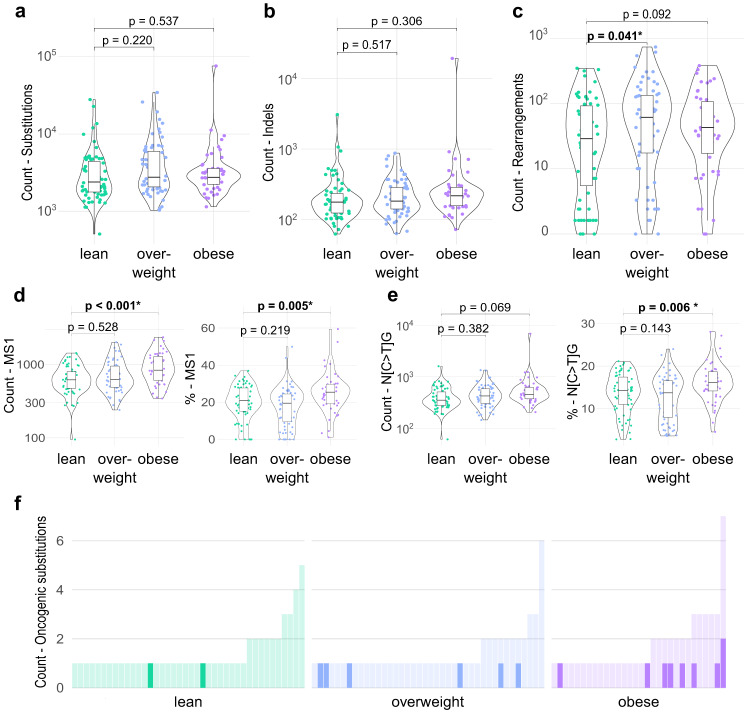
Fig. 3. Association of BMI with mutational burden, genomic instability, and the age-associated mutational signature in patients with NST ER+/HER2− from the ICGC cohort.
a–c Violin/box plots showing the total numbers of substitutions (a), small insertions/deletions (indels) (b), and rearrangements (c) according to BMI categories (lean, n = 67; overweight, n = 64; obese, n = 46). The y axes are log-scaled. d, e Violin/box plots showing the contribution in absolute count (left) and relative percentage (right) of the mutational signature 1 (MS1) (d) and the sequence context N[C > T]G (e) according to BMI categories (lean, n = 67; overweight, n = 64; obese, n = 46). In each boxplot, the box denotes the range from the 25th to the 75th percentile, the center line indicates the median value, and the whiskers specify the maxima and minima excluding outliers. All statistical tests were two-sided. Wald test p values determined for coefficients estimated by linear regressions adjusted for age (>50 vs ≤50) and tumor grade (G3 vs G1/G2), are reported and were not corrected for multiple testing. Exact p values < 0.001 are specified in Supplementary Data 11. f Bar plots presenting the number of oncogenic mutations occurring in BC-specific driver genes in each tumor. The count of mutations having the sequence context N[C > T]G is highlighted in bold colors. Each bar represents a tumor.

